Non-Retrogression Without Law
For five straight cycles (the 1970s through the 2010s), Section 5 of the Voting Rights Act dominated redistricting in states covered by the provision. In these states, district plans had to be precleared with federal authorities before they could be implemented. Preclearance was granted only if plans wouldn’t retrogress, that is, reduce minority representation. Thanks to the Supreme Court’s 2013 decision in Shelby County v. Holder, Section 5 is no longer operative. So what happened to minority representation in formerly covered states after Section 5’s protections were withdrawn? This Article is the first to tackle this important question. We examine all states’ district plans before and after the 2020 round of redistricting at the congressional, state senate, and state house levels. Our primary finding is that there was little retrogression in formerly covered states. In sum, the number of minority ability districts in these states actually rose slightly. We also show that formerly covered states were largely indistinguishable from formerly uncovered states in terms of retrogression. If anything, states unaffected by Shelby County retrogressed marginally more than did states impacted by the ruling. Lastly, we begin to probe some of the factors that might explain this surprising pattern. One possible explanation is the status quo bias of many mapmakers, which is reflected in their tendency to keep minority representation constant. Another potential driver is many line-drawers’ reluctance to use retrogression as a partisan weapon. This reluctance is evident in the similar records of all redistricting authorities with respect to retrogression, as well as in the absence of any relationship between retrogression and change in plans’ partisan performance.
I. Introduction
How has Shelby County v. Holder1 affected minority representation in American legislatures? In this momentous 2013 decision, the Supreme Court effectively nullified Section 5 of the Voting Rights Act (VRA). For nearly half a century, Section 5 had required covered jurisdictions (mostly though not entirely in the South) to obtain permission from the federal government before changing their election laws. Permission (“preclearance”) was granted only if covered jurisdictions could show that their proposed changes wouldn’t result in the worsening of the electoral position of minority voters (“retrogression”). Over the almost fifty years in which Section 5 was in force, minority representation in covered areas didn’t just avoid retrogression. Rather, it increased dramatically, rising about sevenfold in state houses, for example.2
Some scholars anticipated that Shelby County would be “devastating . . . for minority voters in cities, towns, and counties all over this country.”3 Their logic was that many formerly covered jurisdictions continued to have racial and partisan motives to eliminate districts in which minority voters could elect their preferred candidates. Freed from Section 5’s constraints, these jurisdictions would proceed to dismantle many of these districts. Other academics, in contrast, had more muted expectations about Shelby County’s impact. They noted that Shelby County left unscathed the VRA’s other key provision, Section 2, that line-drawers tend to have a status quo bias, and that retrogression is often unnecessary to the achievement of jurisdictions’ redistricting goals.4 These observers therefore predicted that Section 5’s functional demise wouldn’t drastically reduce minority representation.
Now that ten years have gone by since Shelby County—spanning, critically, the bulk of the 2020 redistricting cycle—which camp has been proven right? Surprisingly, there’s next to no literature on how the effective annulment of Section 5 has affected the legislative representation of minority voters. In this Article, we provide the first comprehensive treatment of this important issue. We examine statewide district plans at the congressional, state senate, and state house levels before and after they were redrawn following the 2020 Census. We also study the maps of states formerly covered and uncovered by Section 5. The degree of retrogression in formerly uncovered states is both interesting in its own right and a benchmark with which to compare changes in minority representation in formerly covered states.
In performing these analyses, we face a pair of challenges: defining districts in which minority voters are able to elect their candidates of choice (“minority ability districts”) and determining which districts (before and after the 2020 round of redistricting) satisfy this definition. Supreme Court precedent forbids using crude racial targets to ascertain ability district status.5 So instead we rely on a three-part test derived from lower court rulings just before Shelby County’s curtain fell on Section 5 jurisprudence.6 Under this test, an ability district is one where (1) the minority-preferred candidate typically prevails in the general election; (2) minority votes typically outnumber white votes for that candidate; and (3) the votes of members of different minority groups (like African Americans and Hispanics) are aggregated only if each group’s voters typically favor the same candidate. Our main methodological tool for establishing which pre- and post-2020 districts qualify as ability districts is ecological inference. For the entire country, we run a two-stage, precinct-level model that yields estimates of turnout and candidate preference by racial group in each district. These are exactly the outputs we need to decide if each district is or isn’t an ability district.
Our primary finding is that there was little retrogression in formerly covered states in the 2020 redistricting cycle. At the congressional level, the total number of minority ability districts in states formerly covered in full or in part increased by one. At the state senate level, this figure dipped by just two ability districts. And at the state house level, the total volume of ability districts in formerly covered states again rose by three. Put another way, we analyzed forty-three pairs of pre-2020 and post-2020 district plans for formerly covered states. Out of this group, a supermajority of thirty-one new plans either maintained or boosted minority representation. Of the twelve new plans that reduced minority representation, just three retrogressed by more than a single ability district: the new state house plans of Michigan, Mississippi, and North Carolina.
Nor was the record of formerly covered states in terms of retrogression any worse than that of formerly uncovered states. At the congressional level, in the 2020 round of redistricting, the total number of minority ability districts in formerly uncovered states increased by one—the same rise seen in formerly covered states. At the state senate level, this figure didn’t change at all. And at the state house level, the total volume of ability districts in formerly uncovered states fell by thirteen—compared to the three more ability districts created in formerly covered states. These results establish that not only did minority representation in formerly covered states not decline in absolute terms, it also didn’t drop in relative terms versus the benchmark of formerly uncovered states.
Why wasn’t there much retrogression in formerly covered states in the 2020 redistricting cycle? Our study sheds light on two potential explanations. One is the status quo bias of many mapmakers. If line-drawers are frequently reluctant to disrupt existing district configurations, the number of minority ability districts should stay the same before and after redistricting in many states. This is precisely what we find. In sum, an outright majority of new district plans in formerly covered states (twenty-two of forty-three) perfectly preserved the old volume of ability districts. This proportion rose to a supermajority in formerly uncovered states (seventy-four of one hundred new district plans that scrupulously maintained the prior level of minority representation).
The other factor illuminated by our analyses is the general absence of a strong partisan incentive to eliminate minority ability districts. If either party thought it could reap substantial electoral rewards from retrogression, we should see unified Democratic or unified Republican governments consistently reducing minority representation. However, this pattern doesn’t materialize. We detect no statistically significant difference in retrogression between Democratic and Republican mapmakers, between the parties and nonpartisan line-drawers, or between any redistricting authority and the zero-point denoting no shift in minority representation. Similarly, if dismantling ability districts was a common tactic for pursuing partisan advantage, there should be a relationship between the change in the number of ability districts in the 2020 round of redistricting and the change in the volume of Democratic districts. But there’s no such link. This correlation is zero or near-zero at each electoral level we examine.
The Article proceeds as follows. In Part I, we summarize the law and literature that relate to our study. In particular, we describe Section 5 doctrine and the reasons why minority representation might have fallen in formerly covered states—or not—after the Supreme Court effectively terminated Section 5. In Part II, we explain our methods and data. The key conceptual point is that minority ability districts aren’t limited to majority-minority districts; they also include crossover and coalition districts. In Part III, we present our results. In order, we address retrogression in formerly covered states, retrogression in formerly uncovered states, and the connection (or lack thereof) between partisanship and retrogression. In Part IV, lastly, we discuss our findings. Together they paint a surprising picture of nonretrogression without law: minority representation remaining roughly constant in formerly covered states even after the revocation of the legal mandate that minority representation not be cut.
One last introductory note. Our analyses here shouldn’t be misunderstood to suggest that Shelby County had no impact. We assess only one of the many areas (statewide redistricting) for which Shelby County had implications. Even in this context, we doidentify numerous instances of retrogression: twelve new district plans in formerly covered states that reduced minority representation by at least one minority ability district. Some or all of this retrogression would likely have been avoided had Section 5 remained in effect. Our conclusion, then, is merely that rampant retrogression didn’t occur in formerly covered states in the 2020 redistricting cycle. We freely acknowledge—and emphasize—that some retrogression did take place.
II. Section 5 and Its Demise
Section 5 was (unsurprisingly) the fifth section of the original VRA of 1965, the landmark law often called the crown jewel of the civil rights era.7 Section 5 initially applied to only jurisdictions that (1) used a “test or device” for voting as of 1964, like a literacy test or a good moral character requirement; and (2) had voter registration or voter turnout rates below fifty percent in the 1964 presidential election.8 For an initial five-year period, Section 5 prohibited these mostly southern jurisdictions from changing any of their election laws unless they first obtained preclearance from either the Department of Justice or a federal court in Washington, D.C.9 These federal authorities were to grant preclearance only if covered jurisdictions established that their proposed election law changes “do[] not have the purpose and will not have the effect of denying or abridging the right to vote on account of race or color.”10
Section 5 was subsequently renewed in 1970, 1975, 1982, and, finally, 2006. The first two of these renewals were notable because they added the 1968 and 1972 elections, respectively, as triggers for coverage if jurisdictions used certain voting requirements and had low voter participation rates at those times.11 In contrast, the 1982 and 2006 renewals extended the Section 5 regime without adjusting its coverage formula.12 When the Supreme Court decided Shelby County in 2013, nine states were fully covered by Section 5: Alabama, Alaska, Arizona, Georgia, Louisiana, Mississippi, South Carolina, Texas, and Virginia.13 Specific counties or townships were covered in another six states: California, Florida, Michigan, New York, North Carolina, and South Dakota.14
The substance of Section 5 was set by Congress and the Court in an intricate dance that lasted decades. First, in the 1969 case of Allen v. State Board of Elections,15 the Court held that changes to how votes are aggregated—not just changes to how they’re cast—must be precleared.16 Section 5 “was aimed at the subtle, as well as the obvious,” forms of racial discrimination in voting, and was meant to have “the broadest possible scope.”17 After Allen, covered jurisdictions indisputably (though still quite controversially18 ) had to submit new district plans for preclearance. Next, in the 1976 case of Beer v. United States,19 the Court ruled that Section 5’s effect prong guards against only the worsening of minority voters’ electoral position, not any racial discrimination against minority voters. “The purpose of [Section 5 is] to insure that no voting-procedure changes [are] made that would lead to a retrogression in the position of racial minorities with respect to their effective exercise of the electoral franchise.”20 The Beer Court accordingly reversed a lower court decision denying preclearance to a New Orleans city council map that increased the number of African American ability districts from zero to one21 —but that could have lifted this figure still higher.22
Notice that Beer dealt exclusively with Section 5’s effect prong. For decades after Beer, it was uncertain what kind of purpose sufficed to violate Section 5—only an intent to retrogress or any racially discriminatory motive. In the 2000 case of Reno v. Bossier Parish School Bd. (Bossier Parish II),23 the Court clarified that “the ‘purpose’ prong of § 5 covers only retrogressive dilution,” not “a discriminatory but nonretrogressive purpose.”24 Note, too, that Beer simply counted the number of Black ability districts before and after redistricting to evaluate retrogression.25 In the 2003 case of Georgia v. Ashcroft,26 however, the Court held that “this factor . . . cannot be dispositive or exclusive.”27 Rather, a court also “must examine whether a new plan adds or subtracts ‘influence districts’—where minority voters may not be able to elect a candidate of choice but can play a substantial, if not decisive, role in the electoral process.”28 “In addition to influence districts,” a court must “examine the comparative position of legislative leadership, influence, and power for [minority-preferred] representatives.”29 Lastly, “it is . . . significant . . . whether [minority-preferred] representatives . . . support the new districting plan.”30
Bossier Parish II and Georgia outraged voting rights advocates because they made it easier for covered jurisdictions to win preclearance for their election law changes.31 In response, when Section 5 was next up for reauthorization, these activists convinced Congress to override both these decisions. In its 2006 renewal of Section 5 for another twenty-five years, Congress superseded Bossier Parish II by declaring that “[t]he term ‘purpose’ . . . shall include any discriminatory purpose.”32 Congress also countermanded Georgia by adding two new subsections to Section 5. The first stated that district plans must be denied preclearance if they have “the purpose of or will have the effect of diminishing the ability of [minority voters] to elect their preferred candidates of choice.”33 The second subsection confirmed that Congress’s intention in enacting this amendment was “to protect the ability of [minority voters] to elect their preferred candidates of choice.”34
So stood Section 5 when the Court reconsidered its constitutionality in Shelby County: recently extended for twenty-five more years, strengthened to block measures with discriminatory but nonretrogressive purposes or that traded minority ability districts for other potential benefits, and tied to a coverage formula last updated in 1975. The Court seized on the supposed obsolescence of this formula to strike it down for that reason. The formula “is based on decades-old data and eradicated practices.”35 It “keep[s] the focus on decades-old data relevant to decades-old problems, rather than current data reflecting current needs.”36 “In 1965, the States could be divided into two groups: those with a recent history of voting tests and low voter registration and turnout, and those without those characteristics . . . . Today the Nation is no longer divided along those lines, yet the Voting Rights Act continues to treat it as if it were.”37 The Court further hinted (though without actually holding) that Section 5 itself is unconstitutional. The Court observed that, thanks to the 2006 overrides of Bossier Parish II and Georgia, “the bar that covered jurisdictions must clear has been raised even as the conditions justifying that requirement have dramatically improved.”38 The Court added that the argument that “the preclearance requirement . . . is now unconstitutional” has “a good deal of force.”39
As we noted earlier, some scholars at the time of Shelby County thought the decision’s neutering of Section 5 would prove “devastating” for minority representation.40 This position that Shelby County would have a large negative impact was based on the belief that formerly covered jurisdictions continued to have racial or partisan motives to eliminate minority ability districts. By a racial motive, we mean a dislike for, and a desire to dismantle, ability districts precisely because of the representation they enable by minority-preferred candidates. Intuitively, if formerly covered jurisdictions still had racial motives in redistricting after Shelby County freed them from Section 5’s preclearance regime, they would likely disband substantial numbers of ability districts at their first opportunity.
By a partisan motive, on the other hand, we mean an intention to pursue partisan advantage paired with a conviction that the elimination of minority ability districts would bring about partisan gain. Unlike a mapmaker with a racial motive to dismantle ability districts, a line-drawer with a partisan motive could be agnostic about, or even committed to, minority representation—just less committed to that objective than to a partisan edge. To see why a Democratic mapmaker might have a partisan motive to disband an ability district, think of a two-district area that’s moderately Democratic and that currently contains a heavily Democratic ability district and a narrowly Republican district. It could be possible to flip the narrowly Republican district if the heavily Democratic ability district was redrawn to be less Democratic and no longer an ability district. The mirror image of this logic holds for a Republican line-drawer. Assume a two-district area that’s moderately Republican and that currently contains a narrowly Democratic ability district and a heavily Republican district. Again, it might be feasible to flip the narrowly Democratic ability district (rendering it neither Democratic nor an ability district) if the heavily Republican district was made somewhat more competitive.41
The scholars who feared that Shelby County would gravely undermine minority representation presumably expected such scenarios to be common. But the case where Democrats, at least, need to retrogress to win another seat seems implausible. If an existing Democratic ability district inefficiently packs Democratic voters, that district can typically be made more competitive (thereby potentially flipping an adjacent district) without forfeiting its ability district status.42 Those who anticipated a large negative impact from Shelby County also presumably thought most mapmakers aim to win as many seats as possible for their party. This view may well be accurate at the congressional level, where each state’s delegation is merely a part of the overall House of Representatives. Here, each additional seat for Democrats or Republicans in a given state does influence the national balance of power. At the state legislative level, however, it’s less clear that most line-drawers want to maximize their party’s seats, especially if such maximization comes at a cost in terms of electoral security, compliance with traditional criteria, or, most relevant here, minority representation. Control of a state legislative chamber matters greatly and is worth redistricting aggressively to obtain and maintain. But turning a smaller majority into a larger majority is less consequential and so justifies fewer sacrifices of other goals.43
One reason why Shelby County might not have decimated minority representation, then, is that mapmakers don’t necessarily have strong partisan incentives to eliminate minority ability districts, especially at the state legislative level. A related reason is that line-drawers tend to have a status quo bias: an inclination to retain the basic structure of the districts being redrawn. This thumb on the scale in favor of the status quo is increasingly formalized through criteria like the protection of incumbents and the preservation of prior district cores.44 Even where a status quo bias isn’t an explicit requirement it’s often an implicit one because of legislators’ familiarity with their old districts, their knowledge that they can win those districts, and their aversion to being saddled with new constituents who might not be as keen to vote for them. Crucially, the ability districts that were created in the redistricting cycles before Shelby County had become part of the status quo by the time of the Court’s decision. In the first redistricting cycle after Shelby County, consequently, these districts may have benefited from the same status quo bias as all other existing districts. This factor certainly wouldn’t have insulated ability districts from all significant changes. But it could have induced mapmakers not to dismantle these districts unless they had sound bases for doing so.45
Shelby County itself alluded to the last reason why the Court’s ruling might not have had the “devastating” impact predicted by some. “Our decision in no way affects the permanent, nationwide ban on racial discrimination in voting found in § 2 [of the VRA],” the Court stated in the last paragraph of its opinion.46 Section 2 is a highly complex provision in its own right, and the details of its operation are beyond the scope of this Article.47 The key point for present purposes, though, is that if a series of criteria are satisfied, Section 2 requires jurisdictions to design one or more additional minority ability districts.48 Formerly covered jurisdictions tempted to exploit their newfound freedom to disband ability districts after Shelby County could thus have been deterred from doing so by the prospect of Section 2 litigation. And formerly covered jurisdictions that nevertheless took this leap could have been compelled by actual (not just potential) Section 2 lawsuits to restore the eliminated ability districts. Writing before Shelby County, Samuel Issacharoff made exactly this argument why the nullification of Section 5 wouldn’t greatly diminish minority representation. “[I]n the absence of [S]ection 5 . . . [m]y suspicion is that . . . [S]ection 2 of the Voting Rights Act, the protections of the Fourteenth Amendment, and the fact of being in the process and at the table would afford much protection” to minority voters.49
But there are also points cutting the other way—suggesting that Section 2 isn’t a full substitute for the sidelined Section 5. First, procedurally, Section 2 is a conventional cause of action under which the burden of proof is on the plaintiff, litigation is costly and protracted, and preliminary relief is rare. Section 2 is nothing like Section 5’s unique process that blocked every election law change unless the jurisdiction could show that the policy’s intent was nondiscriminatory and its effect was nonretrogressive.50 Second, substantively, the Supreme Court requires Section 2 plaintiffs to establish that another majority-minority district could be drawn whose minority voters are neither geographically dispersed nor socioeconomically heterogeneous. In contrast, Section 5 applied to all minority ability districts in covered jurisdictions, regardless of their minority voters’ number, dispersion, or heterogeneity.51 Third, the recent litigation record of Section 2 redistricting plaintiffs is abysmal, including less than a handful of victories (versus dozens of defeats) over the last two decades.52 At this point, the risk of Section 2 liability may be more hypothetical than real for jurisdictions considering dismantling ability districts. And fourth, Section 2’s constitutionality is currently under attack on grounds similar to those that ultimately felled Section 5’s coverage formula. In a recent case, the Court rejected the claim that Section 2 is unconstitutional simply because it applies to redistricting,53 but left open the possibility that “the authority to conduct race-based redistricting cannot extend indefinitely into the future.”54
In sum, there are several reasons why Shelby County might have sharply reduced minority representation: formerly covered jurisdictions’ continuing racial and partisan motives to disband minority ability districts as well as the weakness of Section 2 as a substitute for Section 5. But there are also several reasons why Shelby County’s impact on minority representation could have been more marginal: the limited partisan incentive to retrogress in at least some cases, the status quo bias of many line-drawers, and the formal availability (if not the practical potency) of Section 2. Surprisingly, the existing literature barely helps to adjudicate this debate between these two reasonable positions about the consequences of Section 5’s effective demise. A blog post coauthored by two of us55 (and based on an earlier Article56 ) calculates the shares of congressional and state legislative districts, before and after the 2020 round of redistricting, with African American or Hispanic eligible voter populations above forty percent. But this forty percent threshold is only a rough proxy for ability district status. As we explain in Part II, Section 5 jurisprudence requires direct analysis of whether minority voters are, in fact, able to elect their candidates of choice, without reliance on any shortcuts. This methodological issue also affects the one other study of Shelby County’s representational implications, a report for Pluribus News by Brian Amos.57 That report uses a fifty percent threshold for Black or Hispanic population—an even less accurate proxy for ability district status.58
We further note here a trio of recent papers examining how Section 5’s functional end has influenced minority participation(as opposed to representation). Nadine Gibson investigates formerly covered and uncovered counties within North Carolina;59 Mayya Komisarchik and Ariel White look at formerly covered and uncovered counties nationwide;60 and Kyle Raze shifts the geographic level to formerly covered and uncovered states.61 All these works employ difference-in-differences designs and all of them find that Shelby County didn’t lead to lower minority registration or turnout in formerly covered jurisdictions. That is, the participational gap between minority and white citizens in formerly covered areas didn’t grow compared to that same gap in formerly uncovered areas after Shelby County released the former places from Section 5’s preclearance regime.62 These results are interesting and broadly consistent with our own conclusion in Part III that the 2020 redistricting cycle saw little retrogression in terms of minority ability districts in formerly covered states. But we say no more about this trio of papers because they all focus on the possibility of what election lawyers call racial vote denial, or making it harder for minority citizens to vote. This Article, conversely, addresses only the potential for racial vote dilution, or diminishing minority representation by changing how votes are aggregated.63
III. Measuring Retrogression
To reiterate, our research question here is whether, and to what extent, formerly covered jurisdictions cut minority representation after Shelby County rid them of the need to comply with Section 5. We tackle this question at the state level, leaving for future work the impact of Shelby County on minority representation in local governments. At the state level, we consider congressional, state senate, and state house plans before and after they were redrawn in the wake of the 2020 Census. The vast majority of the old plans were enacted while Section 5 was still fully operational; all the new plans were designed in the effective absence of Section 5. We also include all states, formerly covered and uncovered, in our study. Only formerly covered states were affected by Shelby County, but formerly uncovered states provide a useful baseline with which to compare changes in minority representation in formerly covered states.
The legal developments we described in Part I guide our analysis in several respects. Beer made clear that the essential issue with respect to Section 5’s effect prong is retrogression.64 Accordingly, we compare pre-2020 and post-2020 levels of minority representation in formerly covered states to determine if the latter are lower than the former. The 2006 amendments to Section 5 established that only the numbers of minority ability districts before and after redistricting—not the numbers of minority influence districts, nor the power of minority-preferred legislators, nor their views on the new district lines—are relevant to the retrogression inquiry.65 We therefore examine the old and new volumes of ability districts but not any of the factors rejected by the 2006 amendments. And the portions of Georgia not overridden by the 2006 amendments held that retrogression is evaluated on a jurisdiction-wide basis, using the same current demographic and political data to assess the old and new plans.66 We do just that, scrutinizing statewide plans in their entirety with data from the 2020 American Community Survey and the 2020 presidential election.
As methodologically helpful as these legal developments are, they don’t provide us with a workable definition of a minority ability district. As the Supreme Court remarked in the post-Shelby County case of Alabama Legislative Black Caucus v. Alabama,67 the Court has never resolved Section 5’s “application to coalition [and] crossover . . . districts.”68 True, in both Beer and Georgia, the Court seemed to assume that districts with minority shares above fifty percent of some denominator (registered voters, total population, or voting-age population) qualify as ability districts.69 But these brief passages were mere dicta that failed to specify an official definition. More importantly, in Alabama Legislative Black Caucus, the Court ruled that ability district status isn’t settled by any “particular numerical minority percentage.”70 To the contrary, “a mechanically numerical view as to what counts as forbidden retrogression” amounts to “a misperception of the law.”71 In the related Section 2 context, the Court added in the 2017 case of Cooper v. Harris72 that it’s presumptively unconstitutional for mapmakers to use a majority-minority threshold. “[E]stablish[ing] a racial target [that] African-Americans should make up no less than a majority of the voting-age population” is “a ‘textbook example’ of race-based districting.”73
If reliance on a majority-minority (or any other racial) threshold is the wrong way to ascertain minority ability district status, what’s the right way? The best roadmap comes from the only court to have decided a Section 5 case on the merits since the 2006 amendments to the provision, the District Court for the District of Columbia. In a pair of rulings in 2011 and 2012, the three-judge district court that considered whether Texas’s statewide plans for the 2010s should be precleared held that “what matters under Section 5” is minority voters “‘being able’ or ‘having the power’ to elect” their preferred candidates.74 “[I]t is not enough,” moreover, that minority voters “simply go along with the electoral decisions of some [white] voters.”75 Rather, it must be “minority voters themselves who have the ability to elect their preferred candidate[s].”76 They have this ability where “the views and preferences of minority voters in [a multiracial] coalition . . . regularly prevail in the coalition’s selection of candidates.”77 Lastly, for different groups of minority voters (like African Americans and Hispanics) to be combined, the “groups must vote cohesively.”78 “If minority groups split their vote[s] between opposing candidates in the general election, there is by definition no candidate of choice[. . .].”79
Based on this discussion, we use the following definition of a minority ability district.80 First, the minority-preferred candidate must typically prevail in the general election.81 Imagine a district with one hundred total voters, of whom forty are minority voters. The candidate of choice of the forty minority voters (that is, the candidate most of these voters support) must usually be elected. This criterion is the necessary corollary of minority voters “‘being able’ or ‘having the power’ to elect” their preferred candidate.82 That candidate must actually win office.
Second, minority votes for the minority candidate of choice must typically outnumber white votes for that candidate. In the above district, suppose that thirty-five of the forty minority voters pull the lever for the minority-preferred candidate. Then fewer than thirty-five white voters must back that candidate. If more than thirty-five white voters cast their ballots for that candidate, then minority voters might be “simply go[ing] along with the electoral decisions of some [white] voters.”83 “[T]he views and preferences of minority voters” might not “regularly prevail” over those of white voters in the “selection of candidates.”84
And third, the votes of members of different minority groups are aggregated only if no minority group alone controls the district and if each minority group’s voters typically favor the same candidate. In the above district, say that of the thirty-five minority supporters of the minority candidate of choice, there are enough of them from a single minority group to outnumber the white backers of that candidate. Then the district is a minority ability district and there’s no need to aggregate the votes of members of different minority groups. The district is also an ability district if no single minority group’s supporters of the minority-preferred candidate outnumber white supporters—but multiple minority groups’ combined backers of that candidate do outnumber white backers, provided that most voters from each minority group favor that candidate. Posit, however, that thirty white voters support the minority candidate of choice, that of the thirty-five minority backers of that candidate twenty are African Americans and fifteen are Hispanics, and that most Black voters in the district prefer that candidate while most Hispanic voters don’t. Then thanks to this criterion the district isn’t an ability district. “[M]inority groups split their vote[s] between opposing candidates in the general election,” so minority votes for any particular candidate can’t be aggregated.85
It should be apparent that, under our definition, there’s nothing special about a majority-minority (or any other racial) threshold. That is, minority ability districts can be districts where minority members comprise a majority of the citizen voting-age population (CVAP) or “crossover” districts where minority voters are able to elect their preferred candidates only because of white voters who cross racial lines to vote for those candidates. It should also be clear that our definition acknowledges the possibility of “coalition” districts where voters from multiple minority groups vote cohesively and are able to elect their mutual candidates of choice. The district court in the Texas case agreed that “coalition and crossover districts are protected under Section 5.”86 “Since coalition and crossover districts provide minority groups the ability to elect a preferred candidate, they must be recognized as ability districts[. . .].”87 In our analyses in Part III, we sometimes lump all ability districts together and sometimes decompose them into majority-minority, crossover, and coalition districts.
To conduct those analyses, we need more than a definition of a minority ability district. We also need counts of the votes by racial group for each candidate in each district. To get those counts, we can’t simply consult raw election results. Because of the secret ballot, raw election results reveal only the total votes—not the votes by racial group—for each candidate in each district. So instead, we rely on the workhorse method of VRA litigants and scholars: ecological inference.88 In this context, ecological inference leverages information about geographic subunits’ demographic compositions and election results to predict whether and how members of different racial groups voted.89 We run a pair of precinct-level models separately for each current congressional district in the country. The first model estimates voter turnout by racial group; the second model uses the outputs of the first to predict voter partisan preference by racial group.90 In combination, these models yield distinct estimates of African American, Hispanic, and other (mostly white) votes for Democratic and Republican candidates in each precinct, while allowing voter behavior to vary from one congressional district to another.
We flag that there are other reasonable ways to perform ecological inference. Demographic and electoral data can be compiled at the level of the Census block, block group, or tract—not just the precinct. Voter behavior can be predicted within each county or state—not just each district. And a single model can be employed rather than successive models of voter turnout and then partisan preference.91 We carry out ecological inference (1) at the precinct level, (2) within each current congressional district, and (3) in two stages, only because this approach produces overall estimates of voter behavior by racial group that are closest to the results of national exit polls. We also repeat that, consistent with the portions of Georgia that are still good law, we use the most up-to-date possible demographic and electoral data for our ecological inference.92 For demographics, this is data from the 2020 American Community Survey providing CVAP estimates for the 2016-2020 period.93 For elections, the 2020 presidential race is the most recent election contested by the same candidates across the country. As we observed in the margins above, nationwide analyses of voter behavior by racial group necessarily rely on presidential election results.94 In the words of the district court in the Texas case, such “exogenous” election results are also essential for “comparison[s] between benchmark and proposed districts” in Section 5 retrogression inquiries.95
IV. Retrogression in the 2020 Cycle
We now turn from our methods to our findings, which we present in the following order. First, we address the extent of retrogression in formerly covered states in the 2020 redistricting cycle. Second, we compare the extent of retrogression in formerly covered states to changes in minority representation in formerly uncovered states. And third, we begin to probe political factors that might be related to the extent of retrogression, in particular, the identity of the redistricting authority in each state and changes in partisan representation between the old and new district plans.
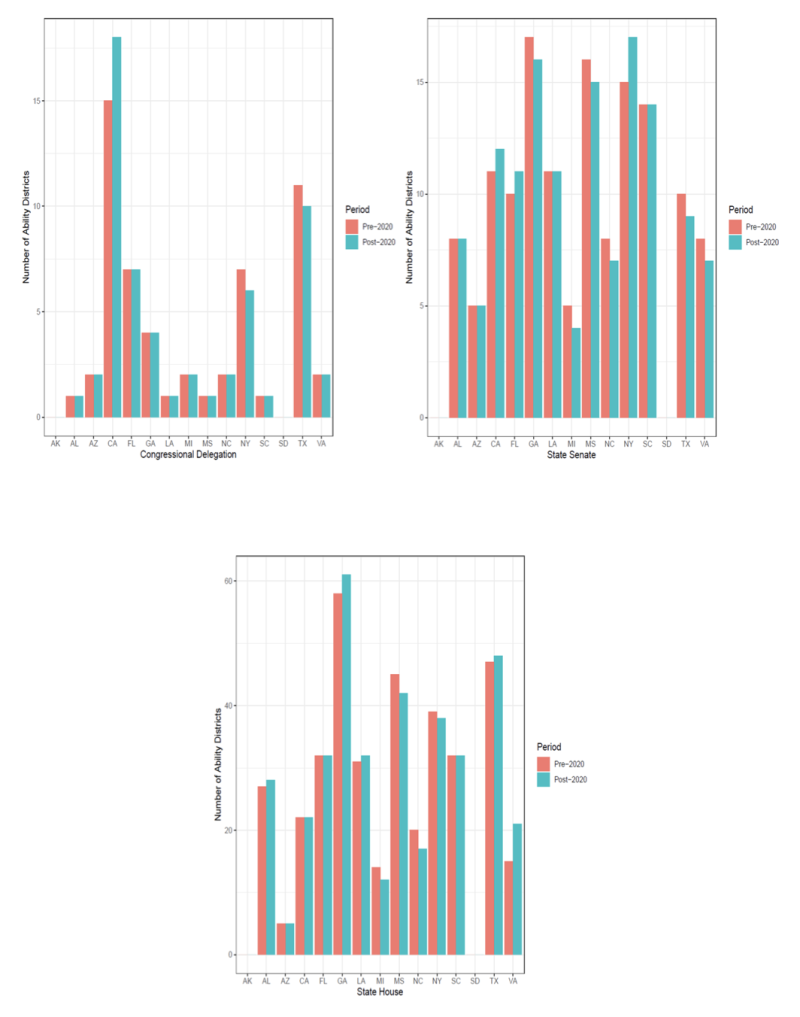
Figure 1, then, displays the total number of minority ability districts in each formerly covered state, before and after the 2020 round of redistricting, at each of three electoral levels. All ability districts are included here, whether they be majority-minority, crossover, or coalition districts. Both states formerly covered in full (Alabama, Alaska, Arizona, Georgia, Louisiana, Mississippi, South Carolina, Texas, and Virginia) and states formerly covered in part (California, Florida, Michigan, New York, North Carolina, and South Dakota) are also included.96 The district plans used before the 2020 round of redistricting were typically those in place for the 2020 elections; the plans used after the 2020 redistricting cycle were typically those in place for the 2022 elections.97 And the three electoral levels covered are congressional, state senate, and state house plans.
At the congressional level, eight of nine states formerly covered in full had the same numbers of minority ability districts before and after the 2020 round of redistricting. The volume of ability districts decreased by one in Texas (from eleven to ten). Four of six states formerly covered in part had the same numbers of ability districts before and after the 2020 redistricting cycle. The volume of ability districts rose by three in California (from fifteen to eighteen), while falling by one in New York (from seven to six).
At the state senate level, five of nine states formerly covered in full had the same numbers of minority ability districts before and after the 2020 round of redistricting. The volume of ability districts decreased by one in Georgia (from seventeen to sixteen), by one in Mississippi (from sixteen to fifteen), by one in Texas (from ten to nine), and by one in Virginia (from eight to seven). One of six states formerly covered in part had the same numbers of ability districts before and after the 2020 redistricting cycle. The volume of ability districts rose by one in California (from eleven to twelve), by one in Florida (from ten to eleven), and by two in New York (from fifteen to seventeen), while falling by one in Michigan (from five to four) and by one in North Carolina (from eight to seven).
And at the state house level, three of nine states formerly covered in full had the same numbers of minority ability districts before and after the 2020 round of redistricting. The volume of ability districts increased by one in Alabama (from twenty-seven to twenty-eight), by three in Georgia (from fifty-eight to sixty-one), by one in Louisiana (from thirty-one to thirty-two), by one in Texas (from forty-seven to forty-eight), and by six in Virginia (from fifteen to twenty-one), while decreasing by three in Mississippi (from forty-five to forty-two). Three of six states formerly covered in part had the same numbers of ability districts before and after the 2020 redistricting cycle. The volume of ability districts fell by two in Michigan (from fourteen to twelve), by three in North Carolina (from twenty to seventeen), and by one in New York (from thirty-nine to thirty-eight).
Figure 1: Total Minority Ability Districts in Formerly Covered States
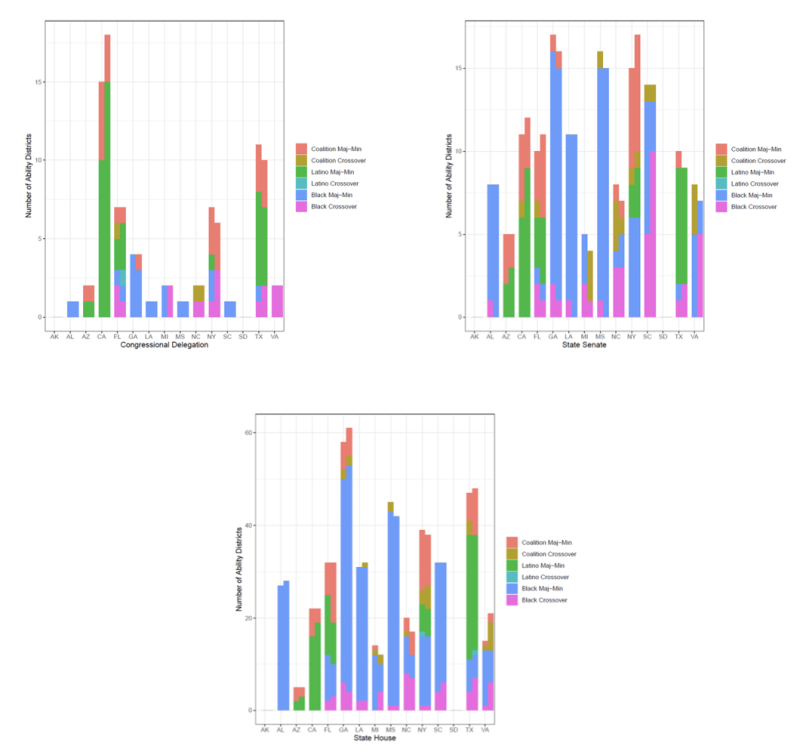
To determine the extent of retrogression in formerly covered states in the 2020 redistricting cycle, the total numbers of old and new minority ability districts are dispositive. But it’s also politically important (if irrelevant under the law of Section 5) what kinds of ability districts existed before, and now exist after, the 2020 round of redistricting. Different types of ability districts have divergent implications for the candidates who run and ultimately prevail, for the representation that’s provided to voters, and for the parties’ statewide fortunes. Figure 2 therefore repeats Figure 1 except that it decomposes ability districts into six mutually exclusive categories: (1) African American majority districts (Black CVAP above fifty percent); (2) African American crossover districts (Black CVAP below fifty percent); (3) Hispanic majority districts (Hispanic CVAP above fifty percent); (4) Hispanic crossover districts (Hispanic CVAP below fifty percent); (5) Black-Hispanic coalition majority districts (combined Black-Hispanic CVAP above fifty percent); and (6) Black-Hispanic coalition crossover districts (combined Black-Hispanic CVAP below fifty percent). In all these ability districts, of course, the minority-preferred candidate prevailed in the 2020 presidential election, minority votes outnumbered white votes for that candidate, and African American and Hispanic votes are aggregated only if neither group alone controlled the district and if each group’s voters favored the same candidate.
One point that emerges from Figure 2 is a modest increase in the number of Hispanic ability districts in formerly covered states after the 2020 redistricting cycle, paired with a modest decrease in the number of African American ability districts. In Congress, the volume of Hispanic ability districts in formerly covered states rose from twenty to twenty-five while the volume of Black ability districts fell from twenty-one to nineteen. In formerly covered states’ state senates, Hispanic ability districts numbered twenty before the 2020 round of redistricting and twenty-six thereafter, while Black ability districts numbered eighty-eight beforehand and eighty-five afterwards. And in formerly covered states’ state houses, Black ability districts declined from 263 to 259 but, in a deviation from the pattern at the other electoral levels, Hispanic ability districts also dropped from 65 to 63.
Figure 2 further documents the enduring—though slightly eroding—dominance of minority ability districts with a minority CVAP above fifty percent. At the congressional level, 83.9 percent of ability districts in formerly covered states before the 2020 redistricting cycle were majority-minority districts (47 of 56), as were 77.2 percent of ability districts after the cycle (44 of 57). At the state senate level, these proportions were a comparable 79.0 percent before the 2020 round of redistricting (109 majority-minority districts of 138 ability districts in formerly covered states) and 78.7 percent thereafter (107 of 136). And at the state house level, these shares were an even higher 88.9 percent before the 2020 redistricting cycle (344 majority-minority districts of 387 ability districts in formerly covered states) and 85.1 percent thereafter (332 of 390).
Figure 2 shows why the dominance of majority-minority districts eroded at the margins, too. The main explanation is the creation of more African American crossover districts with a Black CVAP below fifty percent. In Congress, 12.5 percent of minority ability districts in formerly covered states before the 2020 round of redistricting were Black crossover districts (7 of 56), compared to 19.3 percent after the round (11 of 57). In formerly covered states’ state senates, the ratio of Black crossover to total ability districts similarly increased from 13.0 percent before the 2020 redistricting cycle (18 of 138) to 16.9 percent thereafter (23 of 136). And in formerly covered states’ state houses, this ratio rose as well, from 7.5 percent ex ante (29 Black crossover districts of 387 ability districts) to 10.5 percent ex post (41 of 390). In contrast, the fractions of Hispanic and coalition crossover districts in formerly covered states remained low before and after the 2020 round of redistricting. Combined, these fractions stayed the same or dipped at the congressional level (3.6 percent to 3.6 percent) and the state senate level (8.0 percent to 4.4 percent) while inching upward at the state house level (3.7 percent to 4.4 percent).
Lastly, Figure 2 provides numerous state-specific examples of these overarching trends in formerly covered states. In the wake of the 2020 redistricting cycle, the number of Hispanic ability districts increased in the congressional delegations of California and Florida, the state senate plans of Arizona, California, Florida, and New York, and the state house plans of Arizona and California. On the other hand, the number of African American ability districts decreased in the congressional delegations of Florida and Georgia, the state senate plans of Florida, Georgia, and Michigan, and the state house plans of Florida, Michigan, Mississippi, and North Carolina. After the 2020 round of redistricting, majority-minority districts became scarcer in the congressional delegations of Michigan, New York, and Texas, the state senate plans of Michigan, South Carolina, Texas, and Virginia, and the state house plans of Florida, Michigan, Mississippi, New York, North Carolina, South Carolina, and Virginia. Likely relatedly, African American crossover districts grew more common in the congressional delegations of Michigan, New York, and Texas, the state senate plans of Michigan, South Carolina, Texas, and Virginia, and the state house plans of Florida, Louisiana, Michigan, New York, South Carolina, Texas, and Virginia. (Likely relatedly because the list of plans with fewer majority-minority districts is so similar to that of plans with more Black crossover districts.)
Figure 2: Minority Ability Districts in Formerly Covered States by Category
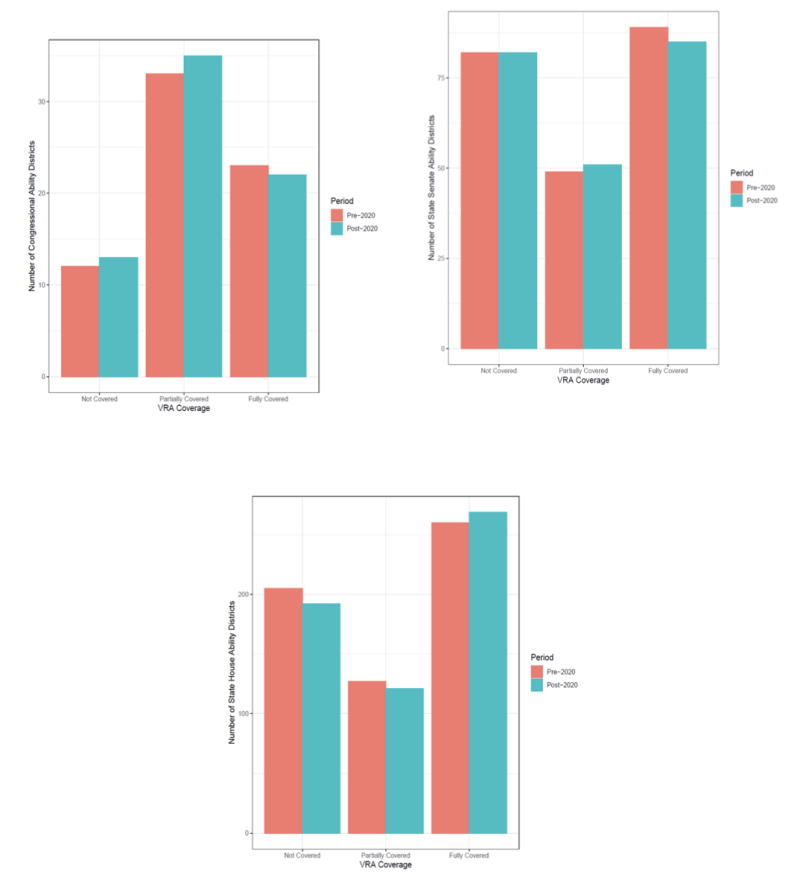
To this point, we’ve examined retrogression only in formerly covered states. We now bring formerly uncovered states into the picture. Figure 3 displays the total numbers of minority ability districts before and after the 2020 redistricting cycle, at the congressional, state senate, and state house levels, in states formerly covered in full, states formerly covered in part, and states not formerly covered. Nine states were formerly covered in full, six were formerly covered in part, and the remaining thirty-five weren’t covered at all when Shelby County was decided in 2013.
In Congress, the total number of minority ability districts in states formerly covered in full decreased slightly from twenty-three before the 2020 round of redistricting to twenty-two after the round. The total number of ability districts in states formerly covered in part increased slightly from thirty-three to thirty-five. And the total number of ability districts in states formerly not covered also rose slightly from twelve to thirteen.
In state senates, the total number of minority ability districts in states formerly covered in full declined somewhat from eighty-nine before the 2020 redistricting cycle to eighty-five after the cycle. The total number of ability districts in states formerly covered in part rose slightly from forty-nine to fifty-one. And the total number of ability districts in states formerly not covered stayed exactly the same at eighty-two.
In state houses, the total number of minority ability districts in states formerly covered in full increased somewhat from 260 before the 2020 round of redistricting to 269 after the round. The total number of ability districts in states formerly covered in part fell somewhat from 127 to 121. And the total number of ability districts in states formerly not covered also dropped somewhat from 205 to 192.
We previously discussed individual formerly covered states and so say nothing more about them here. Among formerly uncovered states, at the congressional level, New Jersey lost one minority ability district in the 2020 redistricting cycle, and Illinois and New Mexico gained one ability district each. At the state senate level, Illinois lost two ability districts, Indiana, New Jersey, and Ohio lost one ability district each, and Massachusetts, Missouri, New Mexico, Rhode Island, and Washington gained one ability district each. And at the state house level, Ohio lost four ability districts, Illinois lost three ability districts, Nevada and Pennsylvania lost two ability districts each, Maryland, Missouri, New Jersey, Tennessee, and Wisconsin lost one ability district each, Colorado, Massachusetts, and Washington gained one ability district each, and Kentucky gained two ability districts.
Figure 3: Total Minority Ability Districts by VRA Coverage Status
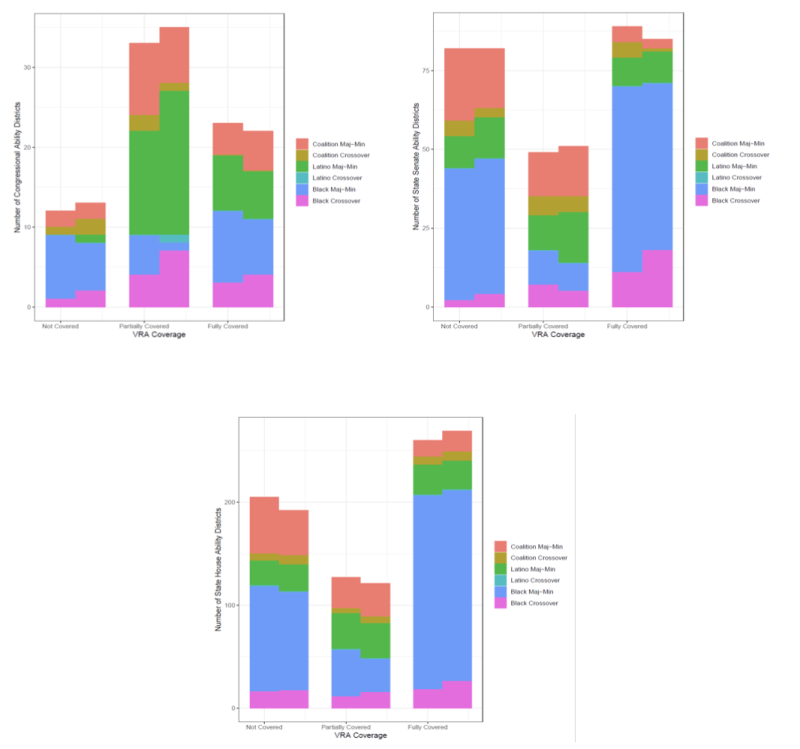
Recall that Figure 2 recapitulated Figure 1 except with minority ability districts decomposed by type. Likewise, Figure 4 is a carbon copy of Figure 3 only with the total number of ability districts for each category of states, point in time, and electoral level broken down by the type of ability district. Again, the six mutually exclusive types of ability districts are Black majority districts, Black crossover districts, Hispanic majority districts, Hispanic crossover districts, Black-Hispanic coalition majority districts, and Black-Hispanic coalition crossover districts.
Each of the themes we identified earlier with respect to formerly covered states applies to formerly uncovered states, too, especially at the congressional and state house levels. Consider the modest increase in the number of Hispanic ability districts and the modest decrease in the number of African American ability districts. In Congress, the volume of Hispanic ability districts in formerly uncovered states rose from zero before the 2020 round of redistricting to one after the round, while the volume of Black ability districts fell from nine to eight. In formerly uncovered states’ state senates, the volume of Hispanic ability districts grew from ten to thirteen, and the volume of Black ability districts also went up from forty-four to forty-seven. And in formerly uncovered states’ state houses, the volume of Hispanic ability districts increased from 25 to 26, while the volume of Black ability districts dropped from 118 to 113.
Or take the enduring, if slightly ebbing, dominance of majority-minority districts. At the congressional level, 83.3 percent of minority ability districts in formerly uncovered states before the 2020 redistricting cycle were majority-minority districts (10 of 12), as were 69.2 percent of ability districts after the cycle (9 of 13). At the state senate level, these proportions were an identical 91.5 percent before and after the 2020 round of redistricting (75 majority-minority districts of 82 ability districts in formerly uncovered states at both times). And at the state house level, these shares were 88.3 percent before the 2020 redistricting cycle (181 majority-minority districts of 205 ability districts in formerly uncovered states) and 86.5 percent thereafter (166 of 192).
In formerly uncovered states as well, the creation of more African American crossover districts is the main explanation for the slightly receding dominance of majority-minority districts. In Congress, 8.3 percent of minority ability districts in formerly uncovered states before the 2020 round of redistricting were Black crossover districts (1 of 12), compared to 15.4 percent after the round (2 of 13). In formerly uncovered states’ state senates, the ratio of Black crossover to total ability districts similarly increased from 2.4 percent before the 2020 redistricting cycle (2 of 82) to 4.9 percent thereafter (4 of 82). And in formerly uncovered states’ state houses, this ratio rose too, from 7.8 percent ex ante (16 of 205) to 8.9 percent ex post (17 of 192).
Figure 4: Total Minority Ability Districts by VRA Coverage Status
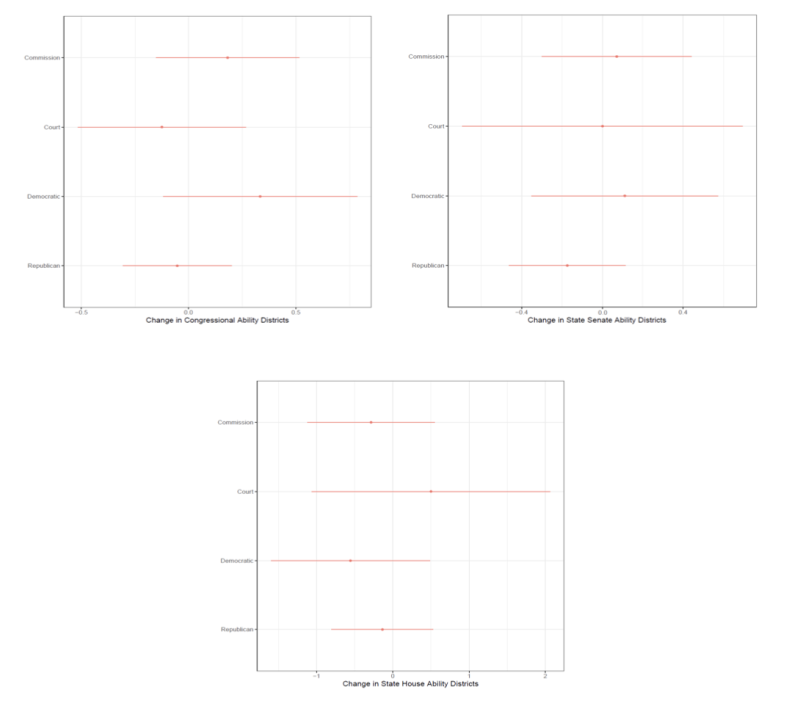
Lastly, we start to investigate the political factors that might be linked to the extent of retrogression. We stress that our inquiry is preliminary and encourage other scholars to delve deeper into the drivers of shifts in minority representation. Figure 5, then, displays the distribution of the change in the number of minority ability districts, from before to after the 2020 round of redistricting, for each category of redistricting authority at each electoral level.98 There are five possible authorities who could be responsible for drawing district lines: unified Democratic government, unified Republican government, divided government, a commission, or a court. This roster reduces to four for the 2020 redistricting cycle, however, because there was no instance of a governor from one party who could have successfully vetoed a district plan nevertheless signing into law a plan enacted by a legislature controlled by the opposing party.99 We also include all states here, not just formerly covered states, both to increase our sample size and because our above findings were similar for formerly covered and uncovered states.
The primary takeaway from Figure 5 is that the identity of the mapmaker had little relation to the extent of retrogression in the 2020 redistricting cycle. All the distributions of the change in the number of minority ability districts include zero—no shift in minority representation—in their heartlands. Statistical tests confirm that the null hypothesis that the mean change in the number of ability districts was zero can’t be rejected for any category of redistricting authority. These tests are also unable to discern a statistically significant difference between the mean changes in the numbers of ability districts for any pair of redistricting authorities. In particular, there’s no clear contrast in the extent of retrogression when unified Democratic governments as opposed to unified Republican governments were in charge of designing districts in the 2020 round of redistricting.
Squinting at Figure 5, there’s some indication that unified Republican governments were more uniform in their approach to—in that they more studiously avoided—both retrogressing and increasing minority representation relative to other mapmakers. At each electoral level, the bulk of the distribution of the change in the number of minority ability districts is comprised of zero-values for unified Republican governments. On the other hand, the analogous distributions for unified Democratic governments include more cases of increased minority representation at the congressional and state senate levels, and more cases of retrogression at the state house level. The analogous distributions for courts include more cases of retrogression at the state senate and state house levels. And the analogous distributions for commissions include more cases of retrogression at the state house level. But while interesting, too much shouldn’t be made of these differences given how few plans some of these actors created and the fact that the gaps never rise to statistical significance.
Figure 5: Changes in Minority Ability Districts by Redistricting Authority
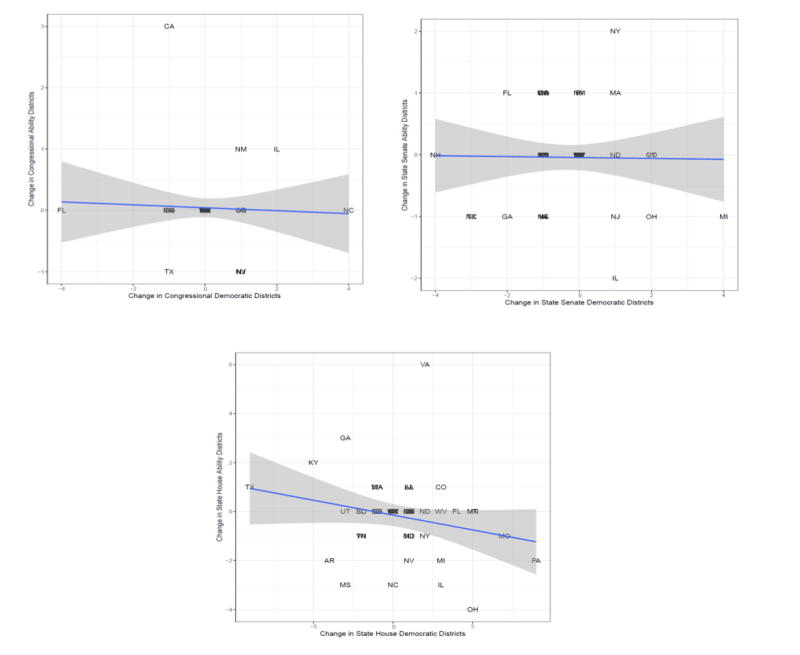
A potential criticism of Figure 5 is that the identity of the mapmaker is too crude a categorization. Maybe some Democratic or Republican line-drawers pursue partisan advantage more aggressively than others, while different commissions and courts rely on different redistricting criteria. Figure 6 responds to this concern by looking directly at shifts in partisan representation in the 2020 redistricting cycle and how they’re correlated with shifts in minority representation. Figure 6 contains three scatter plots, one for each electoral level, each with the change in the number of Democratic districts from before to after the 2020 round of redistricting on the x-axis and the change in the number of minority ability districts on the y-axis. Democratic (or Republican) districts are defined here as districts where Joe Biden (or Donald Trump) received more votes in the 2020 presidential election. And we again include all states, not just formerly covered states, in these charts.
At the congressional and state senate levels, there’s plainly no overall relationship between shifts in partisan representation and shifts in minority representation. For example, the post-2020 congressional plan that moved most in a Democratic direction is North Carolina’s and the new congressional plan that’s most pro-Republican relative to its predecessor is Florida’s. Yet there was no change in the number of minority ability districts in either state’s new plan. Likewise, the post-2020 state senate plans of Illinois and New York both include one more Democratic district than their antecedents. Yet the new Illinois plan retrogresses by two ability districts while the new New York plan adds two ability districts. The best fit lines in the congressional and state senate scatter plots confirm the absence of a relationship between shifts in partisan representation and shifts in minority representation. Both lines are almost perfectly flat and hug the zero-value corresponding to no increase or decrease in the number of ability districts.
In contrast, there’s at least a hint of a negative relationship between the number of Democratic districts and the number of minority ability districts at the state house level. The best fit line is plainly (if not very steeply) sloped downward, showing that as state house plans became more advantageous for Democrats in the 2020 redistricting cycle, compared to their predecessors, they also tended to shed ability districts. True, the correlation between shifts in partisan representation and shifts in minority representation in state houses is a modest -0.23 and fails to reach conventional levels of statistical significance. There exist counterexamples, too, where the volumes of Democratic and ability districts both went up (like Colorado) or down (like Arkansas). Still, it’s intriguing that, on the whole, improved Democratic performance is linked to retrogression at the electoral level with the smallest districts, and well worth further study.
Figure 6: Change in Democratic Districts Versus Change in Minority Ability Districts
V. Non-Retrogression Without Law
Our research question in this Article has an unusually clear answer. There was little retrogression in formerly covered states in the 2020 round of redistricting. Freed from Section 5’s restraints by the Supreme Court’s decision in Shelby County, most formerly covered states didn’t significantly reduce their numbers of minority ability districts. Summing across the three electoral levels we examined, the total volume of ability districts in states formerly covered in full rose slightly from 372 to 376. In states formerly covered in part, the total volume of ability districts declined marginally from 209 to 207. Putting the point another way, we scrutinized forty-three new district plans in formerly covered states.100 Out of this set, an outright majority of twenty-two didn’t increase or decrease minority representation. Another nine plans included more ability districts than their predecessors. Only twelve plans included fewer ability districts than the maps they replaced. Only three plans retrogressed by more than a single ability district: the new state house plans of Michigan, Mississippi, and North Carolina. No one looking at these statistics could say they amount to a large—let alone a “devastating”—fall in minority representation.
Nor do these statistics suffer by comparison to the records of formerly uncovered states in the 2020 redistricting cycle. Across the three electoral levels we surveyed, the total volume of minority ability districts in formerly uncovered states dropped from 299 to 287. This isn’t a dramatic plunge, but it’s inconsistent with the notion that formerly uncovered states substantially increased minority representation after Shelby County while formerly covered states merely treaded water. This conclusion holds considering individual district plans instead of total ability districts. We evaluated one hundred new plans in formerly uncovered states.101 Out of this group, seventy-four preserved the prior number of ability districts, eleven added ability districts, and fifteen subtracted ability districts. The new state senate plan of Illinois and the new state house plans of Arkansas, Illinois, Nevada, Ohio, and Pennsylvania all retrogressed by more than a single ability district. Again, these figures aren’t necessarily worse than the ones for formerly covered states (especially given the greater volume of formerly uncovered states). But they aren’t any better either, thus refuting any claim that Shelby County’s impact might be discernible in a relative (rather than an absolute) fall in minority representation in formerly covered states.
Our results further illustrate the importance of analyzing all minority ability districts, not just majority-minority districts. Amos’s study of majority-minority districts alone determines that “[t]he number of state legislative districts where racial or ethnic minorities make up a majority . . . of the population dropped substantially after the latest round of redistricting.”102 We confirm this finding, but we also show that the decline in majority-minority districts in the 2020 redistricting cycle was mostly, even entirely, offset by the rise in crossover districts. At the congressional level, for instance, the total number of ability districts didn’t “drop[] substantially”—it increased by two.103 Amos maintains as well that “the number of majority-minority seats dropped most significantly in states where Republicans fully controlled the redistricting process.”104 This assertion, too, proves inaccurate with respect to ability districts. As displayed in Figure 5, unified Republican governments didn’t approach ability districts significantly differently from unified Democratic governments in the 2020 round of redistricting. At the state house level, Democrats actually eliminated slightly more ability districts (five) than did Republicans (three).
Turning from the fact of little retrogression in formerly covered states to the explanations for this development, we earlier identified several reasons why minority representation in these states might have been expected to fall—or not—in the 2020 redistricting cycle. The reasons for anticipating retrogression were enduring racial or partisan motives to dismantle minority ability districts. The reasons for thinking minority representation wouldn’t be slashed were the limited partisan incentive to disband ability districts in at least some cases, the status quo bias of many mapmakers, and the deterrent effect of Section 2 of the VRA. Our finding of little retrogression in formerly covered states necessarily means the latter set of factors outweighed the former in the 2020 round of redistricting. This finding alone can’t pinpoint which individual factors were more or less influential, but it does establish the greater collective impact of the considerations mitigating against retrogression.
With respect to these considerations, our preliminary analyses in Figures 5 and 6 suggest the absence of a strong partisan rationale, for the most part, to eliminate minority ability districts. If unified Democratic or Republican governments believed they could win more seats for their party by retrogressing, Democratic or Republican control of redistricting would be associated with more retrogression than control by other authorities. But no such pattern emerges in Figure 5. Neither Democrats nor Republicans systematically retrogressed in the 2020 redistricting cycle, nor was the record of partisan actors significantly different from that of nonpartisan actors in terms of minority representation. Similarly, if there was a link between flipping seats from one party to the other and retrogressing, there would be a correlation between the change in the number of Democratic districts from before to after the 2020 round of redistricting and the change in the number of ability districts. But as Figure 6 indicates, there’s no such correlation at all at the congressional and state senate levels, and only a weak and statistically insignificant correlation at the state house level. By and large, retrogression simply wasn’t a tool that redistricting authorities frequently used to alter the partisan balance of power.
Our analyses in Figures 1–4 provide evidence, too, about the status quo bias of many mapmakers. In many states, line-drawers who wanted to change the number of minority ability districts could have done so reasonably straightforwardly. This is evident in the varying volumes of ability districts that redistricting algorithms typically produce (while complying with all applicable legal criteria).105 Actual mapmakers in the 2020 redistricting cycle, however, were often reluctant to disturb existing minority representation in any way—either by retrogressing or by creating more ability districts. In formerly covered states, Figure 1 shows that the number of ability districts before and after the 2020 round of redistricting was identical in state after state. Our discussion of Figure 3 makes the same point for formerly uncovered states. All told, as noted above, an outright majority of new district plans in formerly covered states (twenty-two of forty-three), and a supermajority of new plans in formerly uncovered states (seventy-four of one hundred), precisely preserved the old volume of ability districts. This careful maintenance of the status quo ante is likely explained by a strong status quo bias in many cases.
Observe that both of these factors highlighted by our analyses are political, not legal. Now that partisan gerrymandering is no longer justiciable (in federal court), there’s nothing legally objectionable about drawing district lines to help or harm any party (as a matter of federal law).106 Likewise, now that Section 5’s anti-retrogression rule applies to no jurisdictions, the status quo ante has no remaining legal significance in redistricting.107 Accordingly, if many line-drawers in the 2020 redistricting cycle didn’t rely on retrogression as a technique for partisan gerrymandering, and if many mapmakers were loath to disrupt the status quo ante of minority representation, these were political rather than legal choices. In a nutshell, this is why we title this Article non-retrogression without law. There was little retrogression in formerly covered states in the 2020 round of redistricting. And at least based on our analyses, which admittedly shed no light on the prevalence of racially discriminatory intent or the deterrent effect of Section 2, this lack of much retrogression seems attributable to politics, not to law. Law after Shelby County holds that retrogression in formerly covered states is permissible. It’s politics that apparently prevented this legally valid drop in minority representation from materializing.
Observe also that minority representation is sensitive to changes to the VRA that impose more requirements on jurisdictions. After Section 5 was originally enacted in 1965, the number of minority ability districts in formerly covered states increased substantially in the 1970 and 1980 redistricting cycles.108 After Section 2 was revised in 1982, and then construed by the Supreme Court in 1986 to compel the creation of new ability districts in some circumstances, the volume of ability districts rose even more sharply in the 1990 redistricting cycle.109 It’s not the case, then, that minority representation is generally nonresponsive to shifts in the legal environment. Instead, at least based on the experience of the last round of redistricting, such lack of sensitivity might be limited to legal changes that make it easier for jurisdictions to eliminate ability districts. Put another way, a one-way ratchet could be at work in this area of law and politics. Under this asymmetric regime, minority representation may go up when the VRA is amended in ways that benefit minority voters and constrain jurisdictions. But minority representation might then stay about the same—not fall—when voting rights law becomes less sympathetic to minority voters and more deferential to jurisdictions.
While our focus in this Article is on minority ability districts of all stripes, we also want to flag our findings about particular types of ability districts. One trend we spot is a modest increase in the number of Hispanic ability districts and a parallel decrease in the volume of African American ability districts. The likely drivers of this trend are demographic. More significantly, America’s Hispanic population grew more quickly between 2010 and 2020 than did its Black population.110 With faster Hispanic population growth should come more opportunities to create Hispanic ability districts—and vice versa with slower Black population growth. Less importantly for our results, the country’s Black population became somewhat less residentially segregated between 2010 and 2020, continuing a gradual, decades-long progression in this direction.111 Greater residential integration is highly desirable, but it does make it harder to draw reasonably compact minority ability districts.112 Especially in southern and western areas experiencing more rapid desegregation, this shift could have contributed to the decline in Black ability districts.
Our other notable finding is a modest drop in the number of majority-minority districts and a corresponding rise in the volume of African American crossover districts. Again, demographics are one probable explanation. With America’s Black population growing at a relatively slow rate and becoming more residentially dispersed, it should be more challenging to design ability districts with Black majorities and easier to craft such districts with smaller Black proportions. Sure enough, the fall in the number of Black majority districts in the 2020 round of redistricting was much steeper than the decline in the overall volume of majority-minority districts. By the same token, Black crossover districts became substantially more common while the prevalence of Latino or coalition crossover districts essentially didn’t budge.
Redistricting strategy is another potential driver of the substitution of African American crossover districts for some Black majority districts. For decades, some scholars have urged exactly this substitution, reasoning that crossover ability districts remain able (by definition) to elect minority voters’ preferred candidates while wasting fewer of their votes and enabling them to be distributed more efficiently across plans in their entirety.113 This advice may finally have been heeded in the 2020 redistricting cycle. That the replacement of Black majority districts with Black crossover districts was intentional in at least some states seems evident from the unusual concentration of this tactic. At the congressional level, a commission in Michigan and a court in New York each drew two new Black crossover districts; combined, these gains amounted to four-fifths of the nationwide increase in these districts. At the state senate level, similarly, a court in Virginia and (surprisingly) a unified Republican government in South Carolina each created five new Black crossover districts, while no other authority added more than one. And at the state house level, Michigan, South Carolina, and Virginia were again responsible for two or more new Black crossover districts, as were Pennsylvania’s commission and (also surprisingly) Texas’s unified Republican government. These results aren’t wholly explicable in partisan terms, but they do suggest that the prioritization of Black crossover districts was purposeful in these states.
Some caveats are in order before we conclude this discussion. Most critically, we only examine retrogression in the 2020 round of redistricting. In the past, it took more than a decade for the full effects of changes to the VRA that benefited minority voters to materialize. The same could be true of Shelby County’s effective nullification of Section 5’s preclearance regime. Formerly covered jurisdictions might be more willing to reduce minority representation in future periods, after Section 5 becomes a more distant memory, than they were over the last few years. Additionally, we only evaluate retrogression at the congressional and state legislative levels. However, all district plans in formerly covered jurisdictions had to be precleared prior to Shelby County, including county, city, school board, and other maps. We can’t say based on our analyses here what happened to minority representation at these lower electoral levels in the 2020 redistricting cycle.
Furthermore, Section 5 used to apply to both district plans (which could constitute racial vote dilution) and voting restrictions (potential racial vote denial). We cited in Part I the handful of papers that address the implications of Shelby County for voting restrictions and minority participation. This Article, though, in no way adds to that literature. Lastly, our conclusions about retrogression are necessarily dependent on our methods and data. It would be legal error for a study of retrogression to overlook crossover or coalition districts. But it would be perfectly permissible for such a study to rely on exogenous and endogenous (i.e., down-ballot) election results, for years beyond just 2020, as inputs into an ecological inference model distinct from ours. Such a study might well yield findings not entirely consistent with the ones we report.
VI. Conclusion
Robert Ellickson famously argues that we often see “order without law”—people working out disputes and arriving at stable equilibria without litigation or even invocation of any legal authority.114 Ellickson emphasizes (the absence of) private law but this Article extends his thesis to a particular public law context. In the area of voting rights, at least in the 2020 round of redistricting, there was little retrogression in formerly covered states even though Section 5 no longer bars any jurisdiction from reducing minority representation. Where does order come from, if not law? Ellickson stresses social norms: the behavioral tenets that arise as people repeatedly interact with one another. One of the explanations for the non-retrogression we generally observe—the status quo bias of many mapmakers—is plainly a social norm. Section 5 no longer requires the preservation of the status quo ante, but many of the repeat players in redistricting still apparently favor continuity over abrupt change. Another factor we identify, the reluctance to use retrogression as a tool for achieving partisan advantage, is likely a social norm as well. As long as retrogression legally couldresult in partisan gain, but is nevertheless avoided, it must be nonlegal forces that are stopping this partisan weapon from being deployed.
To be sure, there’s a lot more law in redistricting than in Ellickson’s case studies of ranchers in rural California or nineteenth-century whalers. District plans have to comply with the one-person, one-vote rule, the ban on racial gerrymandering, Section 2 of the VRA, and any number of state constitutional criteria. District plans themselves are also laws, whether enacted by elected officials or adopted by commissions or courts. None of these provisions, however, necessarily prohibits cuts in minority representation. It was only Section 5 that proscribed retrogression per se, and Section 5 is now inoperative. It’s just a bit of a stretch, then, to say that non-retrogression without law was the story of the 2020 redistricting cycle in formerly covered states. The story was really non-retrogression for the most part without law forbidding retrogression—but the italics can be omitted without transforming the phrase’s meaning.
- 1570 U.S. 529 (2013).
- 2See Nicholas O. Stephanopoulos, Race, Place, and Power, 68 Stan. L. Rev. 1323, 1369 (2016).
- 3See, e.g., Sherrilyn A. Ifill, Voting-Rights Ruling: A Shameful Decision, The Root (June 26, 2013), https://www.theroot.com/voting-rights-ruling-a-shameful-decision-1790897025 [https://perma.cc/AW2U-BSCA].
- 4See, e.g., Samuel Issacharoff, Is Section 5 of the Voting Rights Act a Victim of Its Own Success?, 104 Colum. L. Rev. 1710, 1731 (2004) (focusing on Section 2’s continued vitality).
- 5See, e.g., Ala. Legis. Black Caucus v. Alabama, 575 U.S. 254, 275-77 (2015).
- 6See, e.g., Texas v. United States, 887 F. Supp. 2d 133, 147-51 (D.D.C. 2012) (Texas II), vacated on other grounds, 570 U.S. 928 (2013).
- 7See, e.g., Heather Gerken, Goodbye to the Crown Jewel of the Civil Rights Movement, Slate(June 25, 2013, 3:50 PM), https://slate.com/news-and-politics/2013/06/supreme-court-and-the-voting-rights-act-goodbye-to-section-5.html [https://perma.cc/FJ4B-WZ9F].
- 8Voting Rights Act of 1965, Pub. L. No. 89–110, § 4, 79 Stat. 437, 438 (1965).
- 9See id., § 5, 79 Stat. at 439.
- 10Id.
- 11See Voting Rights Act Amendments of 1970, Pub. L. 91–285, §§ 4–5, 201–02, 84 Stat. 314, 315–17 (1970); Voting Rights Act Amendments of 1975, Pub. L. 94–73, §§ 202, 204, 89 Stat. 400, 401–02 (1975).
- 12See Voting Rights Act Amendments of 1982, Pub. L. 97–205, § 2, 96 Stat. 131, 131–34 (1982); Fannie Lou Hamer, Rosa Parks, and Coretta Scott King Voting Rights Act Reauthorization and Amendments Act of 2006, Pub. L. No. 109–246, § 4, 120 Stat. 577, 580 (2006).
- 13See Jurisdictions Previously Covered by Section 5, U.S. Dep’t of Justice (last updated May 17, 2023), https://www.justice.gov/crt/jurisdictions-previously-covered-section-5 [https://perma.cc/NSU7-EZJ4].
- 14See id.
- 15393 U.S. 544 (1969).
- 16See id. at 565.
- 17Id. at 565, 567.
- 18See, e.g., Holder v. Hall, 512 U.S. 874, 914-36 (1994) (Thomas, J., concurring in the judgment) (arguing at length that the VRA doesn’t apply to redistricting).
- 19425 U.S. 130 (1976).
- 20Id. at 141 (emphasis added).
- 21See id. at 141–42.
- 22See id. at 136.
- 23528 U.S. 320 (2000).
- 24Id. at 328.
- 25Beer, 425 U.S. at 141–42.
- 26539 U.S. 461 (2003).
- 27Id. at 480.
- 28Id. at 482.
- 29Id. at 483.
- 30Id. at 484.
- 31See, e.g., H.R. Rep. No. 109-478, at 65–72 (2006) (criticizing these decisions).
- 32Fannie Lou Hamer, Rosa Parks, and Coretta Scott King Voting Rights Act Reauthorization and Amendments Act of 2006, Pub. L. No. 109–246, § 5, 120 Stat. 577, 581 (2006) (emphasis added).
- 33Id., 120 Stat. at 580–81 (emphasis added).
- 34Id., 120 Stat. at 581.
- 35Shelby Cnty. v. Holder, 570 U.S. 529, 551 (2013).
- 36Id. at 553.
- 37Id. at 551.
- 38Id. at 549–50.
- 39Id. at 547.
- 40Ifill, supra note 3; see also, e.g., Christopher S. Elmendorf & Douglas M. Spencer, Administering Section 2 of the Voting Rights Act After Shelby County, 115 Colum. L. Rev. 2143, 2145–46 (2015) (stating that “Shelby County’s impact was felt immediately” as “governments freed from preclearance . . . made some important changes”); Pamela S. Karlan, Georgia v. Ashcroft and the Retrogression of Retrogression, 3 Election L.J. 21, 28 (2004) (commenting that “[g]utting section 5” would cause “a retrogression in minority voters’ effective exercise of the electoral franchise”).
- 41For more detailed discussions of these redistricting dynamics, see Adam B. Cox & Richard T. Holden, Reconsidering Racial and Partisan Gerrymandering, 78 U. Chi. L. Rev. 553, 572–79 (2011), and Nicholas O. Stephanopoulos, The South After Shelby County, 2013 Sup. Ct. Rev. 55, 102–06.
- 42See, e.g., Cox & Holden, supra note 41, at 578 (arguing that “the optimal partisan strategy for Democrats” is to design Black ability districts “that contain slim majorities of African American voters”).
- 43Cf. Aaron Goldzimer & Nicholas Stephanopoulos, The Novel Strategy Blue States Can Use to Solve Partisan Gerrymandering by 2024, Slate (May 6, 2022, 2:41 PM), https://slate.com/news-and-politics/2022/05/new-york-democrats-partisan-gerrymandering-2024.html [https://perma.cc/SEH6-QAVB] (discussing the implications of the reality that congressional, unlike state legislative, redistricting affects the national balance of power). Supermajority thresholds often bestow additional powers on state legislative majorities large enough to clear them, but the benefits from simple majority control are far more significant.
- 44See generally Robert Yablon, Gerrylaundering, 97 N.Y.U. L. Rev. 985 (2022).
- 45On the status quo bias of line-drawers, see, e.g., Bruce E. Cain & Karin MacDonald, Voting Rights Act Enforcement: Navigating Between High and Low Expectations, in The Future of the Voting Rights Act 125, 135 (David L. Epstein et al. eds., 2006) (“[T]here is a built-in status quo inertia in legislatively controlled redistricting that advantages the boundary changes that were made last time.”), and Michael J. Pitts, The Voting Rights Act and the Era of Maintenance, 59 Ala. L. Rev. 903, 955 (2008) (“[M]any . . . politicians . . . have a self-interest in maintaining the status quo with regard to minority voting rights.”).
- 46Shelby Cnty. v. Holder, 570 U.S. 529, 557 (2013).
- 47For an exhaustive discussion of Section 2, see, for example, Stephanopoulos, supra note 2.
- 48See generally Thornburg v. Gingles, 478 U.S. 30 (1986).
- 49Issacharoff, supra note 4, at 1731; see also, e.g., Bernard Grofman & Thomas Brunell, Extending Section 5 of the Voting Rights Act: The Complex Interaction Between Law and Politics, in The Future of the Voting Rights Act, supra note 45, at 311, 321 (“As long as [S]ection 2 is in place as a fallback route . . . it is possible to more readily contemplate a world without [S]ection 5 [. . .].”); Michael J. Pitts, Let’s Not Call the Whole Thing Off Just Yet: A Response to Samuel Issacharoff’s Suggestion to Scuttle Section 5 of the Voting Rights Act, 84 Neb. L. Rev. 605, 627 (2005) (“[T]he gap has been significantly narrowed between what amounts to a [S]ection 2 violation and what amounts to a [S]ection 5 violation.”).
- 50For a longer discussion of Section 2 and Section 5’s procedural differences, see Stephanopoulos, supra note 41, at 62–73.
- 51For a longer discussion of Section 2 and Section 5’s differences with respect to racial vote dilution, see id. at 73–101.
- 52See Brief of Amici Curiae Professors Jowei Chen et al. at 7–8, Merrill v. Milligan, 142 S. Ct. 879 (2022) (No. 21-1086).
- 53See Allen v. Milligan, 143 S. Ct. 1487, 1516 (2023).
- 54See id. at 1519 (Kavanaugh, J., concurring).
- 55See Eric McGhee et al., How Black and Latino People Did in This Last Round of Redistricting, Wash. Post (Oct. 7, 2022, 7:59 AM), https://www.washingtonpost.com/politics/2022/10/07/race-redistricting-shelby-holder-gerrymandering/ [https://perma.cc/38AR-Y2CZ].
- 56SeeChristopher Warshaw et al., Districts for a New Decade—Partisan Outcomes and Racial Representation in the 2021-22 Redistricting Cycle, 52 Publius: J. Federalism 428 (2022).
- 57See Reid Wilson, Minority Districts Drop After Redistricting, Despite Population Growth, Pluribus News (Nov. 27, 2022, 6:59 AM), https://pluribusnews.com/news-and-events/minority-districts-drop-after-redistricting-despite-population-growth/ [https://perma.cc/7X85-RTV9].
- 58See id.
- 59See Nadine Suzanne Gibson, Moving Forward or Backsliding: A Causal Inference Analysis of the Effects of the Shelby Decision in North Carolina, 48 Am. Pol. Rsch. 649 (2020).
- 60See Mayya Komisarchik & Ariel White, Throwing Away the Umbrella: Minority Voting After the Supreme Court’s Shelby Decision (Sept. 21, 2022) (unpublished manuscript) (on file with the University of Chicago Legal Forum); see also Justin Grimmer & Eitan Hersh, How Election Rules Affect Who Wins, 35 (June 29, 2023) (unpublished manuscript) (on file with the University of Chicago Legal Forum) (using a model similar to that of Komisarchik and White and finding that Shelby County had no statistically significant impact on state-level turnout).
- 61See Kyle Raze, Voting Rights and the Resilience of Black Turnout, 60 Econ. Inquiry 1127 (2022).
- 62See Gibson, supra note 59, at 655–58; Komisarchik & White, supra note 60, at 14–16; Raze, supra note 61, at 1135–38.
- 63For a longer discussion of Section 2 and Section 5’s differences with respect to racial vote denial, see Stephanopoulos, supra note 41, at 106–18.
- 64See Beer v. United States, 425 U.S. 130, 141 (1976). We don’t try to determine whether any of the post-2020 district plans might have run afoul of Section 5’s purpose prong, which now forbids “any discriminatory purpose.” 52 U.S.C. § 10304(c) (emphasis added).
- 65See Fannie Lou Hamer, Rosa Parks, and Coretta Scott King Voting Rights Act Reauthorization and Amendments Act of 2006, Pub. L. No. 109–246, § 5, 120 Stat. 577, 580–81 (2006); H.R. Rep. No. 109-478, at 68–72 (2006).
- 66See Georgia v. Ashcroft, 539 U.S. 461, 470–71, 479, 487 (2003).
- 67575 U.S. 254 (2015).
- 68Id. at 277.
- 69See Georgia, 539 U.S. at 470–71, 486–89; Beer, 425 U.S. at 141–42.
- 70Alabama Legislative Black Caucus, 575 U.S. at 275.
- 71Id. at 277, 275.
- 72581 U.S. 285 (2017).
- 73Id. at 299, 301.
- 74Texas v. United States, 831 F. Supp. 2d 244, 261 (D.D.C. 2011) (Texas I).
- 75Texas v. United States, 887 F. Supp. 2d 133, 150 (D.D.C. 2012) (Texas II), vacated on other grounds, 570 U.S. 928 (2013).
- 76Id.
- 77Id. at 184 (separate opinion by Howell, J.).
- 78Id. at 149.
- 79Id.at 149–50. The district court in the Texas case also identified one situation where retrogression can’t be determined simply by comparing the old and new numbers of minority ability districts: when a state (like Texas after the 2010 Census) gains four or even more congressional districts. See Texas II, 887 F. Supp. 2d at 157–58. This situation doesn’t apply to any state after the 2020 Census, since only Texas saw a change of more than one congressional district, and that change was a gain of just two districts.
- 80For an analogous definition, see Jowei Chen & Nicholas O. Stephanopoulos, The Race-Blind Future of Voting Rights, 130 Yale L.J. 862, 900–01 (2021).
- 81We thus omit primary elections from our analysis, though we acknowledge their usefulness in state-specific studies. We have no choice but to omit primary elections—along with all other state-specific races—because they involve different candidates from one state to another. See, e.g., Stephen Ansolabehere et al., Race, Region, and Vote Choice in the 2008 Election: Implications for the Future of the Voting Rights Act, 123 Harv. L. Rev. 1385, 1400–13 (2010) (also using only presidential election results to analyze racial polarization in voting nationwide); Brian Amos & Michael P. McDonald, Racially Polarized Voting and Roll Call Behavior in the U.S. House, 4–5 (Apr. 14, 2015) (unpublished manuscript) (on file with the University of Chicago Legal Forum).
- 82Texas I, 831 F. Supp. 2d at 261.
- 83Texas II, 887 F. Supp. 2d at 150.
- 84Id. at 184 (separate opinion by Howell, J.).
- 85Id. at 149–50.
- 86Id. at 147.
- 87Texas I, 831 F. Supp. 2d at 267–68; see also, e.g., Bartlett v. Strickland, 556 U.S. 1, 13 (2009) (plurality opinion) (discussing “the terminology often used to describe various features of election districts in relation to the requirements of the Voting Rights Act”).
- 88See, e.g., Gary King, A Solution to the Ecological Inference Problem: Reconstructing Individual Behavior from Aggregate Data, 7–27 (1997) (introducing ecological inference); Ecological Inference: New Methodological Strategies (Gary King et al. eds., 2004) (further refining the technique). Ecological inference is essentially an updated and generalized version of the ecological regression method that the Supreme Court recognized as “standard in the literature for the analysis of racially polarized voting” in Thornburg v. Gingles, 478 U.S. 30, 53 n.20 (1986).
- 89See, e.g., Gary King et al., Information in Ecological Inference: An Introduction, in Ecological Inference, supra note 88, at 1–2 (discussing ecological inference in the context of estimating racial groups’ voting behavior).
- 90Each model is a hierarchical multinomial-Dirichlet model for ecological inference in R × C tables, as developed in Ori Rosen et al., Bayesian and Frequentist Inference for Ecological Inference: The R × C Case, 55 Statistica Neerlandica 134 (2001), and implemented using the eiPack in R. Note that while we run the models separately by congressional district, our data and ultimate estimates are at the precinct level and can be aggregated into whatever political units we choose. We use congressional districts for estimation because they are equipopulous units big enough to minimize statistical noise and small enough to explore geographic variation in racially polarized voting.
- 91See, e.g., D. James Greiner, Ecological Inference in Voting Rights Act Disputes: Where Are We Now, and Where Do We Want to Be?, 47 Jurimetrics 115, 142-43 (2007) (addressing some of these methodological nuances).
- 92See supra note 63 and accompanying text.
- 93See Citizen Voting Age Population by Race and Ethnicity, United States Census Bureau (Dec. 28, 2022), https://www.census.gov/programs-surveys/decennial-census/about/voting-rights/cvap.html [https://perma.cc/3YL4-6T2A].
- 94See supra note 81 and accompanying text.
- 95Texas II, 887 F. Supp. 2d at 142 (D.D.C. 2012).
- 96See Jurisdictions Previously Covered by Section 5, supra note 13.
- 97The only exceptions are the handful of states with odd-year state legislative elections.
- 98For analogous charts using a forty percent CVAP threshold for ability district status, see Warshaw et al., supra note 56, at 446.
- 99Except for a handful of alterations, we use the same coding for control over redistricting as Warshaw et al., supra note 56.
- 100There are fifteen formerly covered states but two of them (Alaska and South Dakota) have only one congressional seat apiece. See, e.g., Directory of Representatives, U.S. House of Representatives, https://www.house.gov/representatives [https://perma.cc/3PR3-CREZ] (last visited Oct. 13, 2023).
- 101There are thirty-five formerly uncovered states but four of them (Delaware, North Dakota, Vermont, and Wyoming) have only one congressional seat apiece and one (Nebraska) has only a single state legislative chamber. See, e.g., Directory of Representatives, U.S. House of Representatives, https://www.house.gov/representatives [https://perma.cc/3PR3-CREZ] (last visited Oct. 13, 2023); Unicam Focus, Nebraska Legislature, https://nebraskalegislature.gov/education/lesson3.php [https://perma.cc/97F9-K4Y9] (last visited Oct. 13, 2023).
- 102See Wilson, supra note 57.
- 103At the state legislative level addressed by Amos, the number of majority-minority districts fell by twenty-nine, but this nontrivial decline was substantially offset by the creation of seventeen more crossover districts.
- 104See Wilson, supra note 57.
- 105See, e.g., Jowei Chen & Nicholas O. Stephanopoulos, Democracy’s Denominator, 109 Calif. L. Rev. 1019, 1039 (2021); Chen & Stephanopoulos, supra note 80, at 915–16.
- 106See Rucho v. Common Cause, 139 S. Ct. 2484 (2019).
- 107No remaining legal significance in that there’s now no prohibition against retrogression per se. Section 2 plaintiffs still need to show that at least one more reasonably compact majority-minority could be created, relative to the status quo ante. See, e.g., Johnson v. De Grandy, 512 U.S. 997, 1008 (1994).
- 108See, e.g., People Search, U.S. House of Representatives: Hist., Art & Archives, http://history.house.gov/People/Search [https://perma.cc/EGH2-WR7S] (last visited Oct. 13, 2023) (including data on minority representation in Congress over time); Geoffrey Skelley, How Majority-Minority Districts Fueled Diversity in Congress, FiveThirtyEight (Aug. 14, 2023, 2:14 PM), https://fivethirtyeight.com/features/majority-minority-congressional-districts-diversity-representation/ [https://perma.cc/FU7T-UW6V]; Stephanopoulos, supra note 2, at 1369 (showing Black and Hispanic state house representation in covered and uncovered states over time).
- 109See id.
- 110SeeRace and Ethnicity in the United States: 2010 Census and 2020 Census, U.S. Census Bureau (Aug. 12, 2021), https://www.census.gov/library/visualizations/interactive/race-and-ethnicity-in-the-united-state-2010-and-2020-census.html [https://perma.cc/U7Z4-UQ2A].
- 111See, e.g., John R. Logan & Brian J. Stults, Metropolitan Segregation: No Breakthrough in Sight, 2 (Aug. 12, 2021).
- 112See, e.g., Stephanopoulos, supra note 2, at 1371–80 (finding a negative relationship between residential integration and minority representation in state houses).
- 113See, e.g., Issacharoff, supra note 4, at 1720–27 (praising a New Jersey district plan in the 2000s that unpacked a number of previously heavily Black districts).
- 114See Robert C. Ellickson, Order Without Law: How Neighbors Settle Disputes (1994).