The Gravity of Legal Diffusion
A persistent empirical finding is that bilateral trade between two countries is proportional to the size of their economies and inversely proportional to their geographic distance. We hypothesize that a similar pattern is likely to hold for the diffusion of laws. We specifically argue that countries’ propensity to update their laws to converge with the leading regulator in a given policy area is likely to be proportional to the size of their economies and inversely proportional to their geographic distance. We then empirically test this theory in the area of antitrust and assess countries’ convergence to the world’s leading antitrust regulator: the European Union. Using a modified gravity equation, we find that a country’s economic size is consistently positively correlated with continued legal convergence and that a county’s distance from the European Union is consistently negatively correlated with continued convergence. These results suggest that a modified gravity model may offer a simple model of legal diffusion that does not requiring strong epistemic and empirical assumptions.
I. Introduction
In 1687, Isaac Newton proposed the Law of Universal Gravitation, which demonstrates that the gravitational force between objects is proportional to the product of their masses and inversely proportional to the square of distances between them.1 Nearly three hundred years later, in 1962, Dutch economist Jan Tinbergen built on Newton’s insight to explain the forces that drive international trade. Specifically, Tinbergen’s gravity model proposed that the size the bilateral trade flows between any two countries is proportional to the size of the countries’ economies and inversely proportional to their geographic distance from each other. The basic intuition behind this claim is that countries with bigger economies will have more occasion to trade with each other, and countries that are further apart will experience greater frictions when trying to engage in trade. In 1969, Tinbergen shared the first Nobel Prize in economics for his work explaining complex economic systems, and his model of international trade has since gone on to be a workhorse of modern economics.
This basic insight is sometimes called a “naïve” model of international trade, because it is divorced from any theoretical underpinnings explaining why these relationships would exist. For instance, in the abstract, it may be reasonable to think that geographic distance is a poor proxy for trade frictions, and that other factors—like whether the countries are separated by land or oceans—would be more relevant predictors of trade flows. But regardless of exactly why these relationships occur in this specific way, as an empirical matter, the gravity model has repeatedly produced reliable estimates of the amount of trade between two countries. In fact, these empirical relationships have proven to be so reliable that Paul Krugman—who won a Nobel Prize for his research on international trade—called gravity equations an example of a law of “social physics.”2
In this paper, we propose a naïve gravity model to explain the diffusion of modern legal regimes. Laws adopted in one country often influence laws adopted in other countries, leading to policy diffusion across jurisdictions.3 These legal regimes often emanate from a dominant jurisdiction that is seen as a leading regulator in a given area, and whose policies become a template towards which other jurisdictions converge.4 We specifically argue that a country’s propensity to adjust their laws to converge with the leading regulator in a given legal area is likely to be proportional to the size of that country’s economy and inversely proportional to its geographic distance from the leading regulator. The basic intuition behind this claim is parallel to the institution of the gravity model for trade: countries with bigger economies are more likely to benefit from legal convergence with leading regulators, but countries that are further away will experience greater frictions that reduce the likelihood of convergence. Building on this intuition, we propose a modified gravity equation that can be used as an empirical specification to predict countries legal convergence with a leading global regulator.
We turn to the area of antitrust law to empirically test our modified gravity model. Antitrust law seeks to regulate the anti-competitive behavior of firms, and by doing so, can influence the distribution of economic and political power within a country. Many countries have updated their antitrust laws frequently, allowing us to examine both its initial diffusion around the world, and its subsequent evolution. Moreover, antitrust law is one of the only legal fields in which detailed legal coding of laws around the world exists for a long time period. This allows us to study the evolution of antitrust laws from 1958 to 2010.5 In prior work we established that the leading regulator in this field is the European Union, whose laws have been more widely emulated than those of any other jurisdiction, including the United States.6 We thus use our modified gravity model to test whether countries have adjusted their antitrust laws to be more similar to the antitrust laws of the European Union over time.
Using a modified gravity model and this cross-country antitrust data, we show that countries’ economic size is consistently positively correlated with continued convergence of their antitrust laws with the laws of the European Union, whereas countries’ distance from the European Union is consistently negatively correlated with continued convergence. These patterns are robust across a range of estimation strategies, and are consistent with our hypothesis that a naïve gravity model should explain legal diffusion.
This Article proceeds as follows. Section 2 introduces the standard gravity model and explains how we modify it to predict the diffusion of laws. Section 3 describes our data on antitrust laws and discusses how we measure legal convergence. Section 4 reports our primary results and a series of robustness checks that show that geographic distance and economic size are strong predictors of legal convergence for countries antitrust laws with the European Union. Section 5 discussions the generalizability of our findings and concludes.
II. A Modified Gravity Model
Although the gravity equation was initially proposed by Tinbergen in the 1960s,7 it did not become a mainstay of international economics until the 1990s.8 At the most basic level, gravity equations provide a simple, robust, and flexible way to predict the bilateral trade between two countries. A variety of gravity equations have been developed, but equation (1) presents the standard version.
The formula in equation (1) suggests that the trade between two countries is proportional to the size of their economies—as measured by their GDP—and inversely proportional to their geographic distance. The intuition of this idea is that the greater the size of a country’s economy, the more reason they have to both import and export their goods. As a result, as two countries’ economies increase in size, they will have greater need and opportunity to engage in trade with each other. However, these forces are mitigated by geographic distance, which increases the costs associated with that trade.
For empirical work, this basic gravity equation is typically translated into a regression like the specification offered in equation (2).

In this equation, the dependent variable Y equals the total trade between country A and country B, which is regressed on the GDP of country A, the GDP of country B, and the geographic distance between county A and country B. As in equation (2), these values are typically logged to represent relationships between these terms that are linear in logs. Variants of the gravity model also often include additional control variables that measure relevant aspects of countries A and county B (e.g., their population or geographic area), or the relationship between the two countries (e.g., if they have a common language).9 As previously noted, this simple approach to estimating trade has proven to been remarkably robust across time, countries, and methodologies.10
We hypothesize that the gravity equation should predict whether countries’ legal regimes in a given policy domain evolve towards greater convergence with the global regulatory leader for that domain. However, instead of predicting a bilateral relationship between any pair of countries, our goal is to explain whether a specific country’s policies will continue to converge towards a regulatory leader in that area. Even though countries typically have bilateral relationships with many countries, often they pick a specific legal model to adopt in a given area of law. Of course, at times countries can emulate different features of several regulatory models but, in many instances, the choice countries face is whether to make their laws consistent with a leading global regulatory model or to customize their laws by either adopting laws to their domestic needs or borrowing from many regulator models. We are focused on explaining the choice of continued convergence to the leading regulatory model using our modified gravity model.
To be clear, our goal is to propose a naïve gravity model, and not to stipulate or test the exact reasons why economic size and geographic distance may predict legal convergence with a regulatory leader. But, to provide some basic intuition for why the process of legal diffusion could be explained as a simple function of economic size and distance is similar to the justification offered for the gravity equation for the trade of goods.
Policy convergence may be proportional to the size of a country’s economy because countries with large economies are likely to have higher quality bureaucracies, and their bureaucrats are also likely to be attuned to global regulatory developments.11 Such states are not only more likely to be informed about the evolution of laws in leading jurisdictions, but also to have the capacity and technical expertise to implement those changes into their own domestic laws. Moreover, in addition to stronger bureaucracies, wealthier countries often have more globally connected firms, resourceful trade associations, and active academic and policy communities. In many cases, these groups will be invested in ensuring that their country’s domestic rules are in line with international norms.12
Similarly, policy convergence may be inversely proportional to the geographic distance between a given country and the regulatory leader. This is, in part, because countries that are geographically distant from the global leader in a given area likely have less close commercial and political ties with that leader. They are thus less likely to actively seek input from the lead jurisdiction or have frequent interactions among bureaucrats or business leaders. As trade relations are deepest among geographically proximate countries, close countries have a reason to engage in active regulatory cooperation to ensure smooth trade between them—a process less essential for far-away jurisdictions. For instance, businesses are most vested in regulatory alignment across the primary markets in which they operate; a corporate actor in a distant market is, therefore, less likely to advocate dynamic alignment with the lead regulator. All this suggests that convergence is likely to be more pronounced among geographically proximate countries.
Equation (3) translates these basic intuitions into an empirically testable regression specification.

Here, the dependent variable Y is the change in policy agreement for country A and the regulatory leader R between time 1 and time 0. In other words, this is a measure of whether a country has converged, stagnated, or customized.13 This measure is regressed on the log of the GDP for country A in time 1, the log of the distance between country A and regulatory leader R, and a measure of the policy agreement between country A and the Regulatory Leader in time 0. This equation thus provides a generalized framework to explore the factors that explain countries’ patterns of dynamic diffusion.
III. Data and Measures
We now turn to introducing our data on antitrust law from countries around the world. We then explain how we use that data to measure convergence between a given country’s legal regime and the European Union.
A. Antitrust Data
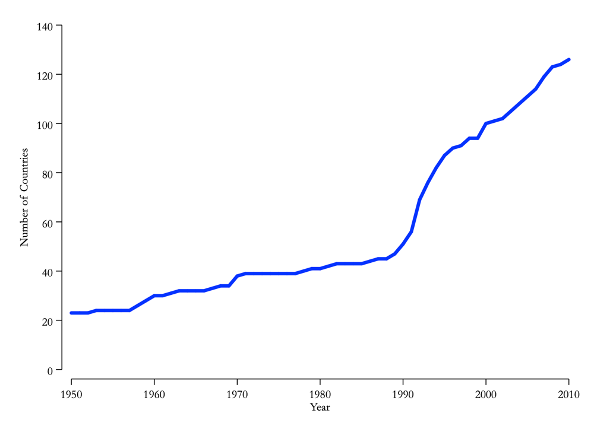
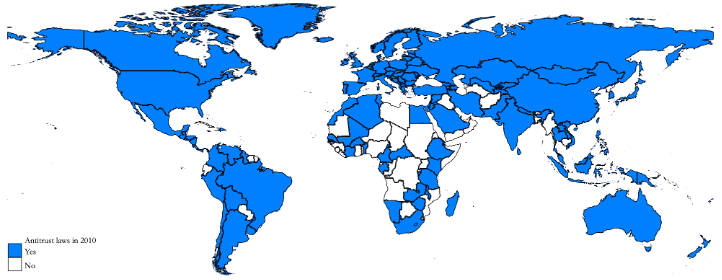
To test our argument that gravity models are likely to predict legal diffusion, we use data from the Comparative Competition Law Dataset (CCLD).14 The CCLD includes data on antitrust laws from 1889, when the first modern antitrust statutes were adopted, to 2010. To illustrate the data, Panel A of Figure 1 reports countries with antitrust laws in place from 1950 to 2010. In 1950, just 23 countries had antitrust laws; by 2010, this increased to over 130 countries. Additionally, Panel B of Figure 1 maps countries with antitrust laws by 2010, revealing that countries from all regions, accounting for over 95 percent of the world’s GDP, have adopted these policies.
Figure 1: Adoption of Antitrust Laws
1A: Countries with Antitrust Law, 1950 to 2010
1B: Countries with Antitrust Law, 2010
The CCLD offers two advantages necessary for testing our theory. First, unlike projects that code countries’ laws at just one moment in time,15 the CCLD includes data on every antitrust law that 126 countries adopted in any year up to 2010.16 This includes all laws—even criminal laws, sector-specific regulations, or constitutions—which include provisions that regulate anti-competitive activity. The CCLD data suggests that countries have passed an average of five distinct laws regulating anti-competitive activity.
Second, the CCLD includes detailed coding of the content of those laws. Following prior scholarship, we focus on 36 core provisions that are central to antitrust policy.17 These core provisions cover four broad topics: (1) rules on the scope of countries’ antitrust authority (e.g., whether private parties may initiate antitrust cases or what remedies are available); (2) rules on merger control (e.g., whether firms must notify the government about their mergers prior to closing a transaction); (3) rules on abuse of dominance (e.g., whether dominant firms are prohibited from tying the sale of one product to another); and (4) rules regulating anticompetitive agreements (e.g., whether the law prohibits firms from engaging in price-fixing). Each provision is coded as a binary for each country-year: countries either have the relevant provision in their law or they do not.
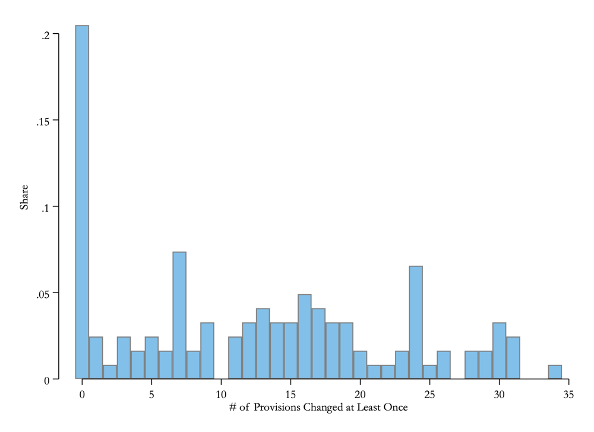
The coding of multiple laws per country and multiple provisions per law makes it possible to study legal evolution after initial policy diffusion. Figure 2 illustrates this by reporting the number of core provisions that countries amended between the adoption of their initial antitrust laws and 2010. Panel A reveals that 20.5 percent of countries with antitrust regimes made 0 changes to a core provision, thus allowing their laws to stagnate after initial adoption. But the other 79.5 percent of countries amended core pieces of their antitrust regimes. The median number of changes is 12.5, but it ranges as high as 34 in the case of China. Panel B maps countries by the number of changes to core provisions of their antitrust law. It reveals, for example, that many African countries have not amended any core antitrust provisions, the US has made relatively few changes, and several European countries have made many changes.
Figure 2: Changes to Core Antitrust Provisions
2A: Distribution of Changes
2B: Changes by Country
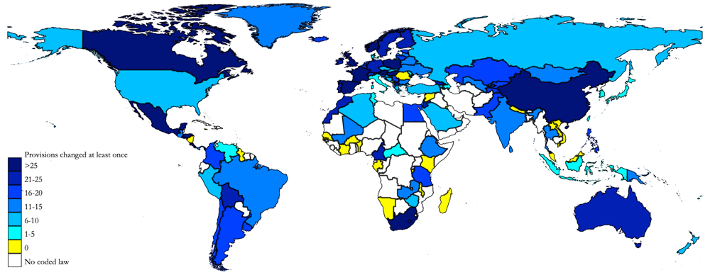
Taken together, the results in Figure 2 illustrate that at least some countries have continued to amend the antitrust laws after continued adoption, which makes it possible to measure convergence to a global regulatory leader. But, additionally, the results in Figure 2 also illustrate that not all countries have made the same number of amendments, which provides at least some initial suggestive evidence that the degree of convergence to leading regulatory models may not be uniform across countries.
B. Measuring Convergence
To assess diffusion after initial adoption, we adopt a method from the comparative law literature and compare the coding of legal rules from individual countries to the coding of the leading global regulatory model.18 We specifically code countries’ agreement with the EU antitrust regime because, although the US pioneered modern antitrust law, prior research has shown that the EU has emerged as the leading global regulatory model for antitrust.19
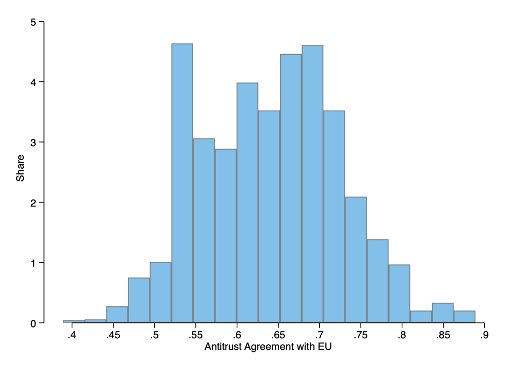
To measure convergence with the EU, we calculate the percent of the 36 provisions for which a given county has the same coding as the EU in a given year (hereafter called their “Antitrust Agreement”). For instance, if a country had the same coding as the EU for 18 of the 36 core provisions in a given year, it would have an 0.5 Antitrust Agreement for that year. We calculate this measure for each country in each year it had an antitrust regime in place after 1958, the year the EU first had antitrust law. Panel A of Figure 3 reports the distribution of countries’ Antitrust Agreement with the EU across all country-years between 1958 and 2010. (To avoid overstating the degree of convergence or stagnation, we omit EU members and countries that have not adopted antitrust law from this and all subsequent analyses.) The median level of Antitrust Agreement with the EU is 0.64, which corresponds to the same coding for 23 of 36 provisions.
Figure 3: Antitrust Agreement with the EU
3A: Antitrust Agreement
3B: Change in Antitrust Agreement
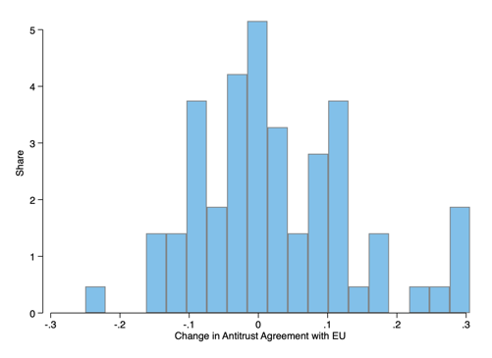
To measure diffusion patterns after initial adoption, we then calculate the “Change in Antitrust Agreement” with the EU between the first year after 1958 that each country had an antitrust regime and 2010 (for countries with an antitrust regime prior to 1958, we calculate the Change in Antitrust Agreement from 1958 to 2010). For instance, when Iceland adopted an antitrust law in 1993, it had the same policy as the EU for 21 of 36 core antitrust provisions (0.58 Antitrust Agreement); but by 2010, Iceland had the same policy as the EU for 32 of 36 core antitrust provisions (0.89 Antitrust Agreement). Iceland’s Change in Antitrust Agreement with the EU would thus be 0.31. Panel B of Figure 3 plots the distribution of countries’ Change in Antitrust Agreement with the EU. The figure reveals that the modal country had no change relative to the EU, but that the plurality of countries had greater agreement with the EU over time.
IV. Results
We next report our results testing our modified gravity equation. We first present basic results testing the equation, and we then present a series of tests showing that these results are robust to a range of alternative specifications.
A. Primary Results
Figure 4 directly explores whether economic size and distance can explain legal diffusion. Panels A and B of Figure 4 report binned scatterplots that investigate the bivariate relationships between economic size and distance, respectively, and Change in Antitrust Agreement with the EU. Because the amount of possible Change in Antitrust Agreement is influenced by the degree of initial agreement (i.e., a country that initially has a near-perfect agreement with the EU has less room to converge than a country initially in little agreement with the EU), the binned scatterplots and lines of best fit all control for initial Antitrust Agreement.
For Panel A of Figure 4, the x-axis is the natural log of the country’s GDP per capita, which we standardize for easy interpretation (i.e., 0 is the mean value, and values of -1 or 1 represent one standard deviation below or above the mean, respectively). The figure reveals a clear positive relationship between the log of GDP per capita and Change in Antitrust Agreement, which suggests that greater state capacity is associated with higher rates of convergence.
For Panel B of Figure 4, the x-axis is the geographic distance to the EU, measured as the natural log of distance to Brussels—where most EU institutions are established and thus EU laws adopted—in 1000 kilometers, which we also standardize. The figure reveals a clear negative relationship between distance to the EU and Change in Antitrust Agreement, suggesting that greater geographic distance is associated with low rates of convergence.
Figure 4: Predicting Change in Antitrust Agreement
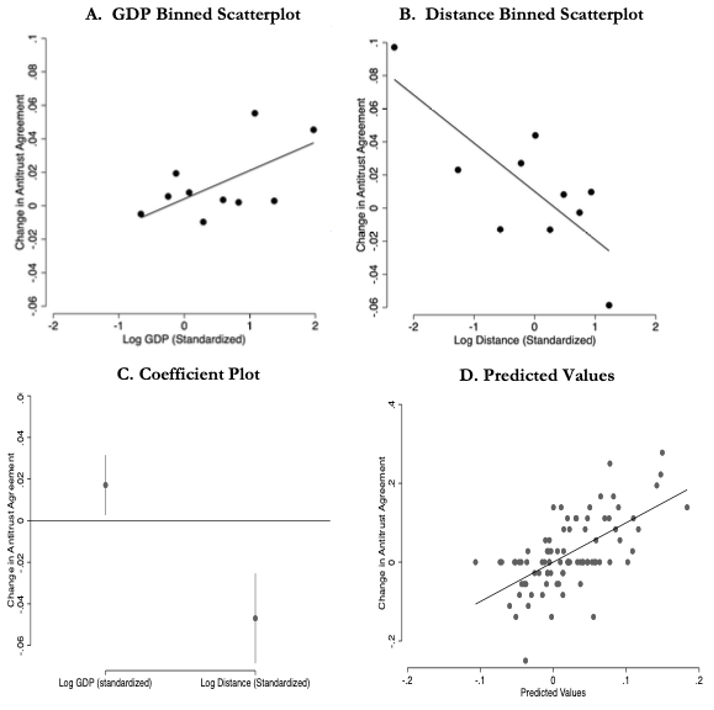
Table 1: Regressions Estimating Change in Antitrust
Agreement Relative to the EU
Panel C of Figure 4 reports the results of a regression estimating the specification offered in Equation (3). It specifically reports the point estimates and confidence intervals for the standardized measures of log GDP and log distance. It again reveals that log GDP is positively associated with Change in Antitrust Agreement and log distance is negatively associated with Change in Antitrust Agreement. Panel D of Figure 4 reports a scatter plot of predicted values of Change in Antitrust Agreement from the regression in Panel C and the actual Change in Antitrust Agreement. These results reveal a clear, strong relationship between the modified gravity equations’ predictions and actual policy convergence.
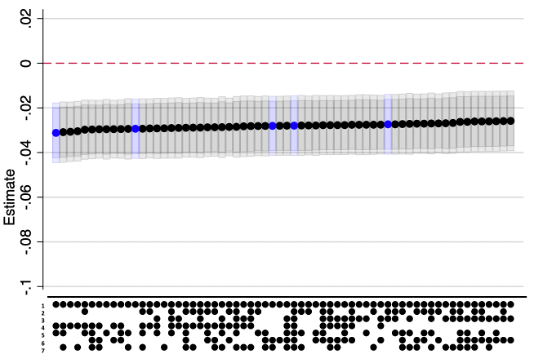
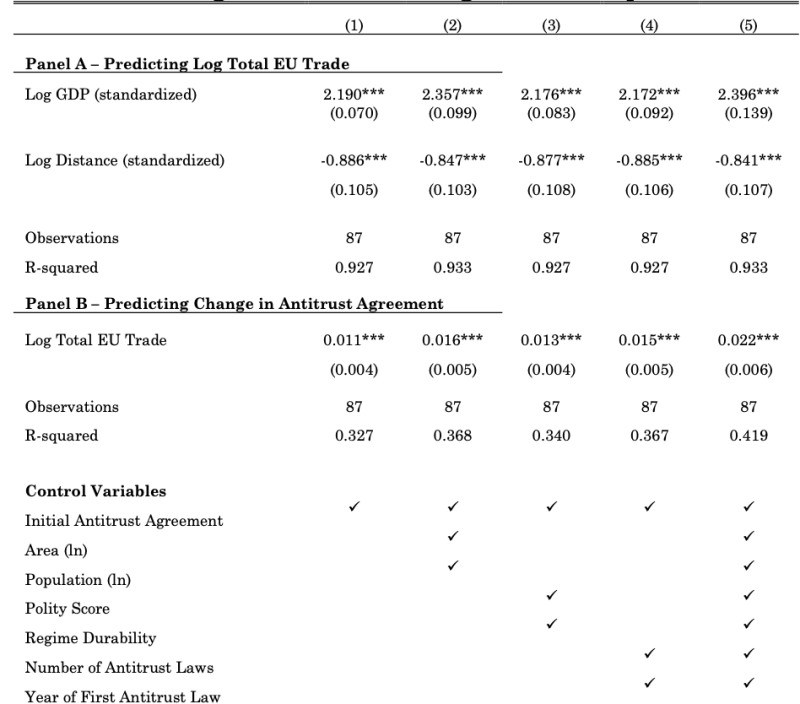
To further investigate these relationships, Table 1 regresses countries’ Change in Antitrust Agreement against these two variables. Column 1 only controls for a country’s initial Antitrust Agreement; Column 2 adds controls for the country’s size (i.e., the logs of their area and population);20 Column 3 adds controls for the country’s political system (i.e., their polity score and regime durability); Column 4 adds controls for the country’s history with antitrust law (i.e., the number of antitrust laws it has passed and the first year it adopted an antitrust law); and Column 5 controls for all these variables simultaneously. All control variables are measured in 2010, and a constant sample is used for all regressions to ensure that any differences across specifications are not attributable to changes to the samples.
In Table 1, the coefficients for the variables of interest are all in the hypothesized directions and all are statistically significant at the 0.1 level or higher. To put the magnitude of these results in perspective, the results in Column 5 suggest that moving from the 10th percentile (in our data, Laos) to the 90th percentile (in our data, South Korea) in log GDP is associated with a change of 0.09 in Antitrust Agreement. A change of 0.09 in Antitrust Agreement would move the median country in 2010 from an Antitrust Agreement of 0.64 to an Antitrust Agreement of 0.73, putting it in roughly the 86th percentile of countries for 2010.
Additionally, the results in Column 5 suggest that moving from the 10th percentile (in our data, Macedonia) to the 90thpercentile (in our data, Singapore) in log distance is associated with a change of -0.07 in Antitrust Agreement. A change of -0.07 in Antitrust Agreement would move the median country in 2010 from an Antitrust Agreement of 0.64 to an Antitrust Agreement of 0.57, putting it in roughly the 15th percentile of countries for 2010. In other words, the results are not only consistently statistically significant, the size of the effects appear to be substantively meaningful.
B. Robustness Checks
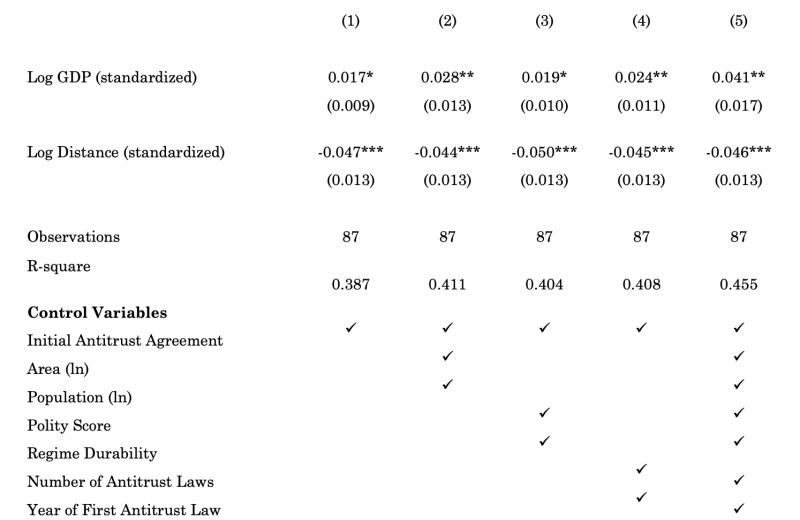
These results are robust to a range of alternative model specifications. First, Figure 5 reports specification curves that plot the coefficients and confidence intervals for 64 regressions using every possible combination of control variables from Table 1. The figure specifically plots the point estimates from these separate regressions using solid dots, and then the 90 percent confidence intervals are plotted in dark gray and the 95 percent confidence intervals are plotted in light gray. Additionally, the five specifications reported in Table 1 are plotted in blue, and the coefficients are ordered based on their size.
Figure 5: Specification Curves
A. Log GDP (Standardized)
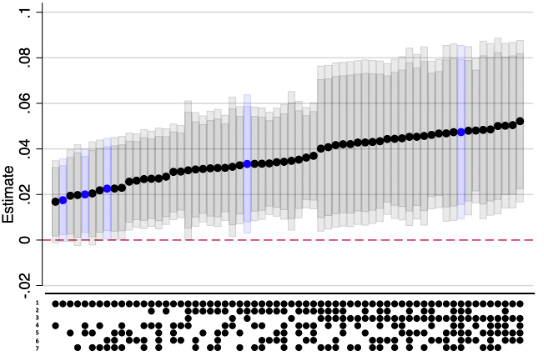
B. Log Distance (Standardized)
The results reported in Figure 5 are consistent in direction, magnitude, and statistical significance with our primary results. These results suggest that our primary results are not a product of the particular combinations of control variables we included in our primary models, and give some reassurance that omitted variable bias is not driving our results.
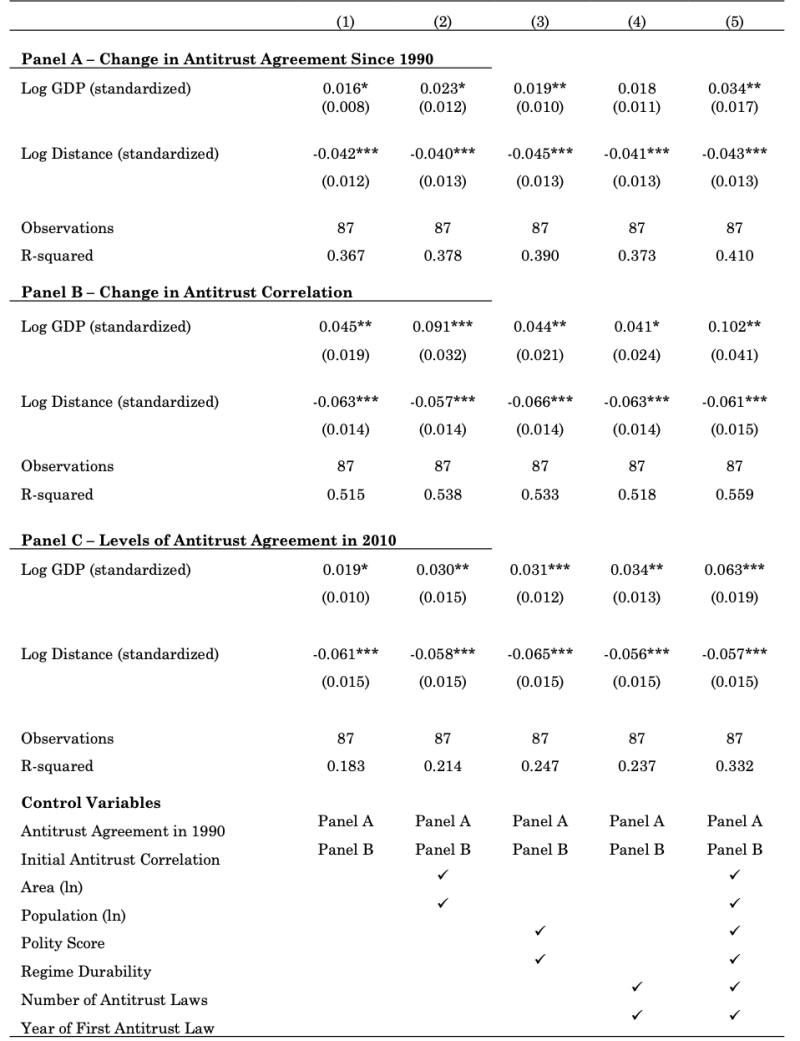
Second, our dependent variable is measured as Change in Antitrust Agreement with the EU from the first year a given country had an antitrust regime until 2010. However, prior research has suggested that the EU model of antitrust law only became more prevalent than the US model in roughly 1990.21 We thus defined an alternative dependent variable as Change in Antitrust Agreement with the EU since 1990. Panel A of Table 2 estimates our primary specifications when using change in Antitrust Agreement since 1990 as our dependent variable (we also control for Antitrust Agreement in 1990 instead of initial Antirust Agreement in all specifications). When using this alternative dependent variable, the results are consistent with the primary results reported in Table 1.
Third, for easy interpretation, we measured Antitrust Agreement as the percent of the 36 provisions for which a given county has the same coding as the EU in a given year. Some comparative law research, however, has instead measured agreement as the correlation across a vector of binary variables.22 Panel B of Table 2 estimates our primary specifications when using a correlation measure as our dependent variable, and again finds consistent results.
Fourth, following Equation (3), we have focused on measuring the change in Antitrust Agreement with the EU over time. However, the logic of the gravity also suggests that, regardless of initial agreement, Antitrust Agreement in the year 2010 should vary based on countries’ economic size and geographic distance. Panel C of Table 2 uses Antitrust Agreement in 2010 as the dependent variable, and again finds that levels of antirust agreement with the EU are proportional to the size of their economies and inversely proportional to their geographic distance.
Table 2: Regressions Using Alternative Measures of Antitrust Convergence
Finally, we have argued that economic size and distance can explain legal diffusion. However, as we explained in Section 2, standard gravity models use economic size and distance to predict trade. It is thus possible that trade itself might more accurately predict legal diffusion than the combination of economic size and distance. To assess this, we first re-estimated our specifications from Table 1 while using the log of total trade (defined as imports plus exports) with the EU in 2010 as our dependent variable. Panel A of Table 3 reports these results, which reveal that the standard gravity result holds for our sample and approach. That is, in 2010 for our sample of countries, the log of GDP is positively correlated with total trade with the EU, and the log of distance to Brussels negatively correlated with total trade with the EU. Next, we re-estimate our specifications from Table 1 while now using total trade with the EU in 2010 as the key explanatory variable (and, as in Table 1, using Change in Antitrust Agreement as the dependent variable). The results in Panel B of Table 3 reveal that greater trade is positively associated with greater Change in Antitrust Agreement. Importantly, however, the r-squared is slightly higher in Table 1 than in each of the corresponding specifications of Panel B of Table 3. This suggests that economic size and distance do more to explain legal diffusion than just trade itself.
Table 3: Regressions Estimating Relationship with Trade
V. Conclusion
We hypothesized that a modified gravity equation would predict legal convergence to the leading regulator in a given area of law. We then found support for this evidence by looking at the convergence of countries’ antitrust laws with the European Union’s antitrust regime.
Before concluding, it is worth noting several limitations of our results. For instance, we only test these relationships using data on 36 provisions of countries’ antitrust laws from 1958 to 2010. It is possible that these results do not generalize outside of this time period, outside of this set of provisions of countries’ antitrust laws, or outside the area of antitrust more generally. Additionally, further research is needed to understand the mechanisms that may explain these results.
Moreover, this pattern may be more likely to hold in certain legal areas than others. For instance, prior research suggests that countries’ shared legal origins—i.e., whether they historically had a common law or civil law system—is more likely to predict their having similar property laws than similar antitrust laws.23 That research hypothesized that countries are more likely to update newer areas of law, such as antitrust, to converge with leading regulatory models. In contrast, more traditional areas of law, such as property, are less susceptible to being modified towards leading global models. Along these lines, we would expect that our modified gravity model would be more likely to predict convergence in newer regulatory areas.
We also expect that our modified gravity model would be more likely to predict convergence in areas where there is greater benefit from regulatory convergence. For instance, in areas like financial regulation, regulators have created incentives for firms to lobby for continued convergence with the EU model across jurisdictions.24 This is because, if the EU deems these countries’ regulatory frameworks as “equivalent” to the EU’s, firms from that country are permitted to offer financial services within the EU. In areas where there is greater benefits from regulatory alignment—like access to important markets—we thus would expect greater convergence in ways predicted by the gravity model.
With those limitations and caveats in mind, in this Article we have offered a simple empirical framework to test ongoing policy diffusion. We specifically presented evidence that economic size and geographical distance are key factors that explain legal diffusion. We simplify our model in this way even though much existing scholarship seeks to isolate specific diffusion mechanisms, distinguishing, for example, between competition, learning and emulation as drivers of diffusion.25 We instead believe that these various diffusion mechanisms are not necessarily mutually exclusive alternatives. For example, in setting up an antitrust regime, policymakers often seek to attract foreign capital (competition), learn from successful regulation elsewhere (learning), and also interact with peers and experts in epistemic communities that reinforce neoliberal ideas (emulation). Very strong assumptions are needed to construct spatial matrices that distinguish between such diffusion mechanisms at the country level. This is because there is a small number of countries in the world, and considerable overlap in the cultural, economic, and political relationships between pairs of countries. For these reasons, a simple model that predicts an association—namely that economic size will be positively correlated with legal convergence and geographic distance will be negatively correlated with legal convergence—can have significant analytical utility.
That said, future research will be needed to explore the conditions under which a modified the gravity model can predict legal convergence. But based on our initial results in the area of antitrust, this Article has offered strong initial support for the idea that a gravity model may provide a powerful, intuitive, and simple model for understanding legal diffusion.
- 1For a more thorough account of this history, see Scott Baier & Samuel Stanndaert, Gravity Models and Empirical Trade, Oxford Research Encyclopedia of Economics and Finance (2020).
- 2See, e.g., Paul Krugman, Development, Geography, and Economic Theory (1997).
- 3Seegenerally Frank Dobbin et al., The Global Diffusion of Public Policies: Social Construction, Coercion, Competition, or Learning?, 33 Ann. Rev. Soc. 449 (2007); Giacomo Zanello et al., The Creation and Diffusion of Innovation in Developing Countries: A Systematic Literature Review, 30 J. Econ. Surv. 884 (2015); Kevin L. Cop et al., The Global Evolution of Foreign Relations Law, 116 Am. J. Int’l L. (2021).
- 4See, e.g., Anu Bradford, The Brussels Effect: How the European Union Rules the World (2020).
- 5Anu Bradford et al., Competition Gone Global: The Comparative Competition Law and Enforcement Datasets, 16 J. Empirical Legal Stud. 411 (2019).
- 6Anu Bradford et al., The Global Dominance of European Competition Law Over American Antitrust Law, 16 J. Empirical Legal Stud.731 (2019). See also William E. Kovacic, The United States and Its Future Influence on Competition Policy, 22 Geo. Mason L. Rev. 1157 (2015); Spencer Weber Waller, The Omega Man or the Isolation of U.S. Antitrust Law, 52 Conn. L. Rev. 123 (2020).
- 7Jan Tinbergen, Shaping the World Economy: Suggestions for an International Economic Policy (1962).
- 8Keith Head & Thierry Mayer, Gravity Equations: Workhorse, Toolkit, and Cookbook, inHandbook of International Economics 131 (Gopinath et al. eds., 2014).
- 9See, e.g., Francesc Ortega and Giovanni Peri, Openness and Income: The Roles of Trade and Migration, 92 J. Int’l Econ. 231 (2014).
- 10See Thomas Chaney, The Gravity Equation in International Trade: An Explanation, 126 J. Pol. Econ. 150 (2018). For a discussion of the development of gravity models that also explores antitrust policy, see Anu Bradford & Adam Chilton, Trade Openness And Antitrust Law, 62 J. L. & Econ. 29 (2019).
- 11See, e.g., Elissa Berwick & Fotini Christia, State Capacity Redux: Integrating Classical and Experimental Contributions to an Enduring Debate, 21 Annual Rev. Pol. Sci. 71 (2018).
- 12See,e.g., Beth A. Simmons & Zachary Elkins, The Globalization of Liberalization: Policy Diffusion in the International Political Economy, 98 Am. Pol. Sci. Rev. 171 (2004).
- 13As shown in Equation 2, when gravity equations are used to predict trade, the dependent variable is typically log transformed. As Panel B of Figure 3 shows, however, our measure of change in policy agreement is roughly normally distributed and centered around zero. We thus do not log transform our outcome variable.
- 14Bradford et al., supra note 5.
- 15See, e.g., Rafael La Porta et al., Law and Finance, 106 J. Pol. Econ. 1113 (1998); Yun-chien Chang et al., Drawing the Legal Family Tree: An Empirical Comparative Study of 170 Dimensions of Property Law in 129 Jurisdictions, 13 J. Legal Analysis 231 (2021).
- 16The data only goes through 2010 due to when the data collection for the CCLD project began. See Bradford et al., supra note 5. As we note below in Section 5, the fact the data ends in 2010, and antitrust laws have continued to evolve, does limit the generalizability of our results. Moreover, it is worth noting that the CCLD is largely complete, but there are three countries not included in the CCLD that likely had antitrust laws by 2010: Djibouti, the Faroe Islands, and Iran.
- 17See, e.g., Anu Bradford & Adam Chilton, Competition Law Around the World from 1889 to 2010: The Competition Law Index, 14 J. Comp. L. & Econ. 393 (2018); Bradford et al., supra note 6; Timothy Besley et al., Antitrust Policies and Profitability in Non-Tradeable Sectors, 3 Am. Econ. Rev.: Insights 251 (2021); Amit Zac et al., Competition Policy and the Labor Share, J. L., Econ., & Org. (2021), available at https://doi.org/10.1093/jleo/ewad008[https://perma.cc/LRF8-D6X5]; Michael O. Allen & Kenneth Scheve, Sustaining Capitalism and Democracy: Lessons from Global Competition Policy, 24 Int’l Stud. Rev. viac018 (2022).
- 18See, e.g., Zachary Elkins et al., Baghdad, Tokyo, Kabul: Constitution Making in Occupied States, 49 William and Mary L. Rev. 1139 (2008); Zachary Elkins et al., The Endurance of National Constitutions (2009); David S. Law & Mila Versteeg, The Declining Influence of the United States Constitution, 87 N.Y.U. L. Rev. 762 (2012).
- 19See Braford, supra note 4; Bradford et al., supra note 17.
- 20It is worth noting that adding controls for a country’s size in addition to the country’s GDP in gravity models reflects an alternative way of conceptualizing country’s economic “mass.” See, e.g., Kenneth A. Reinert, Gravity Models, in The Princeton Encyclopedia of the World Economy 567 (2009). Although this is not the most common way to specify mass for gravity models, some research has estimated gravity models while controlling for GDP and measures of a country’s size simultaneously. See, e.g., Konstantinos Kepaptsoglou, et al., The Gravity Model Specification for Modeling International Trade Flows and Free Trade Agreement Effects: A 10-Year Review of Empirical Studies, 3 Open Econ. J. 1 (2010).
- 21See Braford, supra note 4; Bradford et al., supra note 17.
- 22See Law & Versteeg, supra note 18.
- 23Anu Bradford et al., Do Legal Origins Predict Legal Substance?, 64 J. L. & Econ. 207 (2021).
- 24See Stavros Gadinis, The Politics of Competition in International Finance Regulation, 49 Harv. Int’l L.J. 447 (2008); Stavros Gadinis, Three Pathways to Global Standards: Private, Regulator and Ministry Networks, 109 AM. J. Int’l L. 1 (2015).
- 25See,e.g., Martha Finnemore, International Organizations as Teachers of Norms: The United Nations Educational, Scientific, and Cultural Organization and Science Policy, 47 Int’l Org. 565 (1993); Frank Dobbin et al., The Global Diffusion of Public Policies: Social Construction, Coercion, Competition, or Learning?, 33 Ann. Rev. Sociology 449 (2007); Katerina Linos, Diffusion Through Democracy, 55 Am. J. Pol. Sci. 678 (2011); Katerina Linos, Democratic Foundations of Policy Diffusion: How Health, Family, and Employment Laws Spread Across Countries (2013).